
|
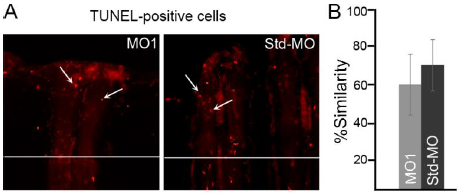
Fig. S2
Smc3 knockdown does not increase the level of apoptosis. (A) Representative images of TUNEL-positive cells in MO1-injected and Std-MO injected fins. The MO1/Std-MO were injected in 3 dpa fins and harvested at 1 dpe/4 dpa. TUNEL-positive cells were counted by eye from the distal-most 250μm of the 3rd ray. Arrows identify TUNEL-positive cells and the white horizontal line indicates the plane of amputation. (B) The graph reveals no significant difference between the MO1-injected fins compared to Std-MO injected fins using the percent similarity method. For each experiment n=8 fins. For statistical significance, two tailed unpaired Student's t-test was used where P<0.05. Mean+ s.e.m. is represented by error bars. Scale bar is 50 μm.