
|
Fig. 5
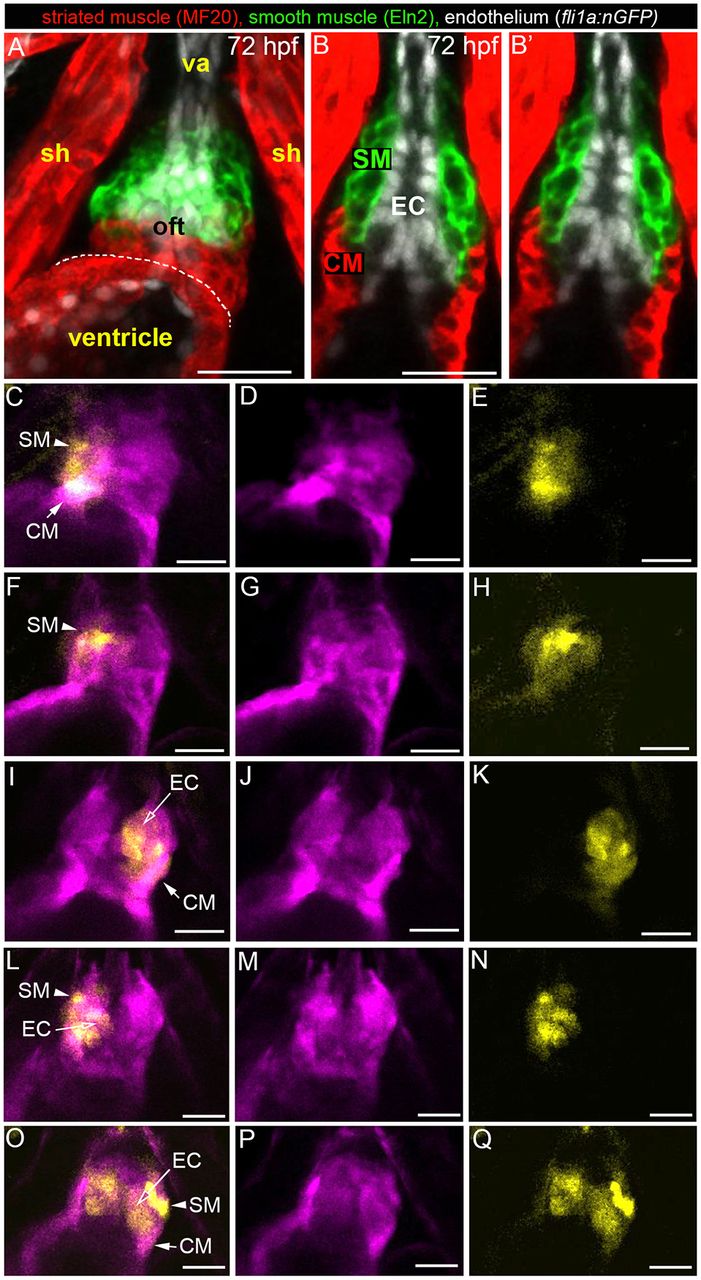
PA2 progenitors give rise to three OFT lineages. (A,B) Confocal images of the OFT in a 72 hpf Tg(fli1a:nGFP) embryo triple immunostained to detect OFT myocardium (MF20 antibody, red), smooth muscle (α-Eln2 antibody, green) and endothelium (α-GFP antibody, white). A z-stack (A) and single planes (B,B′) are shown. B′ is a duplicate of B without the labels and provides an unimpeded view of the physical relationships between OFT lineages. OFT endocardium is surrounded by two collars of muscle, a myocardial collar abutting the ventricle and an adjacent smooth muscle collar that extends to the ventral aorta. (C-Q) Single planes from confocal z-stacks of OFTs in 72 hpf live Tg(nkx2.5:Kaede) embryos in which right-sided (C-H,L-N), left-sided (I-K) or bilateral (O-Q) photoconversion of Kaede+ cells in PA2 was performed at 28 hpf. OFT cells carrying the native (pseudocolored magenta) and photoconverted (pseudocolored yellow) Kaede protein are shown. Merged (C,F,I,L,O) and single-channel (D,E,G,H,J,K,M,N,P,Q) images are shown. The lineage identities of the labeled cells (arrows) were inferred based on location. Ventral views, anterior up. sh, sternohyoideus muscle; va, ventral aorta; oft, outflow tract; SM, smooth muscle; EC, endocardium; CM, cardiomyocytes. Scale bars: 25 µm.