
|
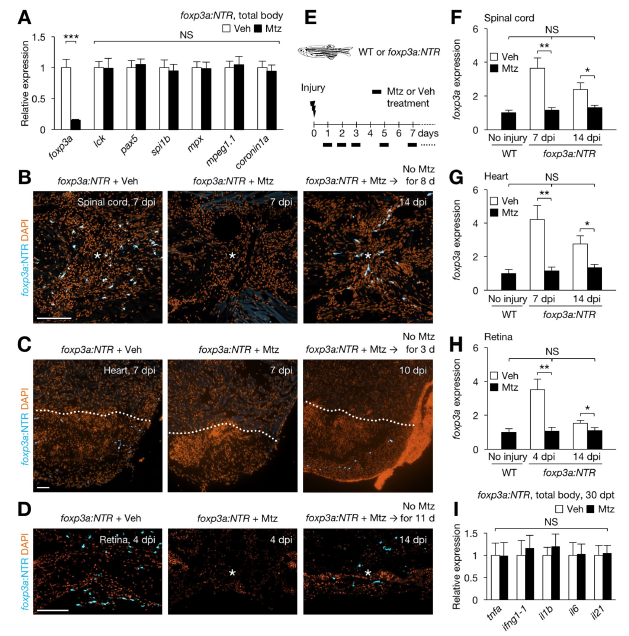
Fig. S1
Inducible ablation of zTreg cells, Related to Figure 4. (A) foxp3a:NTR fish were treated overnight on 3 consecutive days with vehicle (Veh) or metronidazole (Mtz), and total fish samples were used for qRT-PCR analysis of lck (T cells), pax5 (B cells), spi1b (myeloid cells), mpx (neutrophils), and mpeg1.1 and coronin1a (macrophages) (mean ± SEM, n = 5). Exposure of foxp3a:NTR fish to Mtz reduced endogenous foxp3a expression by approximately 85%, without altering the expression of other immune cell markers. Gene expression is shown relative to the levels in vehicle controls. (B) foxp3a:NTR fish were injured at the spinal cord and treated overnight with Veh (left) or Mtz (middle and right) at 1, 2, 3 and 5 dpi. The spinal cords were analyzed via immunofluorescence against TagCFP at 7 dpi (left and middle) and 14 dpi (right; after an 8-day interval without Mtz treatment). Asterisk, injury epicenter. (C) foxp3a:NTR fish were injured at the cardiac ventricle and treated overnight with Veh (left) or Mtz (middle and right) at 4, 5, and 6 dpi. The hearts were analyzed at 7 dpi (left and middle) and 10 dpi (right; after a 3-day interval without Mtz). Dotted line, wound border. (D) foxp3a:NTR fish were injured at the retina and treated overnight with Veh (left) or Mtz (middle and right) at 1, 2, and 3 dpi. The retinas were analyzed at 4 dpi (left and middle) and 14 dpi (right; after a 11-day interval without Mtz treatment). Asterisk, injury epicenter. (E) zTreg cell ablation protocol used throughout this study. After 7 days, Mtz or Veh treatments were performed every second day for the duration of the experiment. (F–H) Clutch mate WT and foxp3a:NTR fish were subjected to injury and drug treatments as described in (E), and foxp3a expression in the spinal cord (F), heart (G), and retina (H) was measured by qRT-PCR (mean ± SEM, n = 5). (I) qRT-PCR analysis of inflammatory cytokine genes in foxp3a:NTR fish after a 30- day treatment regimen as described in E (mean ± SEM, n = 5). dpt, days post treatment. Single confocal sections are shown in B-D. DAPI: 4',6-diamidino-2- phenylindole. *P < 0.05, **P < 0.01, ***P < 0.001, Mann–Whitney U test. NS, not significant. Scale bars, 50 μm.
Reprinted from Developmental Cell, 43, Hui, S.P., Sheng, D.Z., Sugimoto, K., Gonzalez-Rajal, A., Nakagawa, S., Hesselson, D., Kikuchi, K., Zebrafish Regulatory T Cells Mediate Organ-Specific Regenerative Programs, 659-672.e5, Copyright (2017) with permission from Elsevier. Full text @ Dev. Cell