
Fig. 5
|
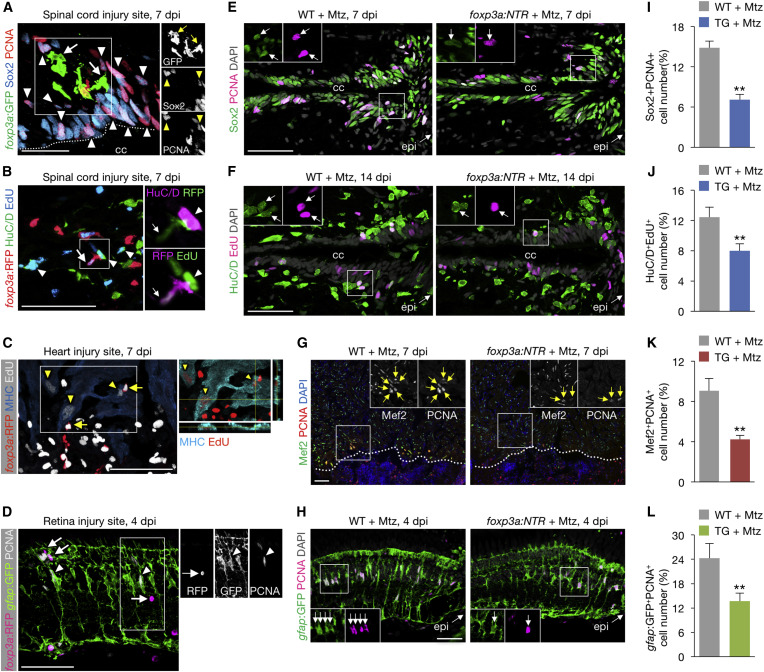
Fig. 5
zTreg Cells Promote Regenerative Precursor Cell Proliferation
(A and B) zTreg cells (arrows) interacting with proliferating neural progenitor cells (A; arrowheads point to Sox2+PCNA+) and newly differentiated neurons (B; arrowheads point to HuC/D+EdU+). Right panels show single-channel confocal sections of the demarcated regions. The dotted line marks the border of the central canal (cc).
(C) zTreg cells (arrows) interacting with proliferating cardiomyocytes (arrowheads point to MHC+EdU+). Image on the right shows the xz and yz planes of the demarcated region.
(D) zTreg cells (arrows) interacting with proliferating Müller glia (arrowheads point to gfap:GFP+PCNA+). Right panels show single-channel confocal sections of the demarcated region.
(E–H) Proliferation of neural progenitor cells (E), newly differentiated neurons (F), cardiomyocytes (G), and Müller glia (H). Insets show single-channel confocal slices (E, F, and H) or epifluorescent images (G) of the demarcated regions. Arrows mark co-labeled cells. Dotted lines indicate the wound border. epi, injury epicenter.
(I–L) Quantification of (E), (F), (G), and (H), respectively (mean ± SEM, n = 6–7).
Confocal projections of z stacks are shown, except for the epifluorescent images in (G). ∗∗p < 0.01, Mann-Whitney U test. Scale bars, 50 μm.
Reprinted from Developmental Cell, 43, Hui, S.P., Sheng, D.Z., Sugimoto, K., Gonzalez-Rajal, A., Nakagawa, S., Hesselson, D., Kikuchi, K., Zebrafish Regulatory T Cells Mediate Organ-Specific Regenerative Programs, 659-672.e5, Copyright (2017) with permission from Elsevier. Full text @ Dev. Cell