
Image
|
Figure Caption
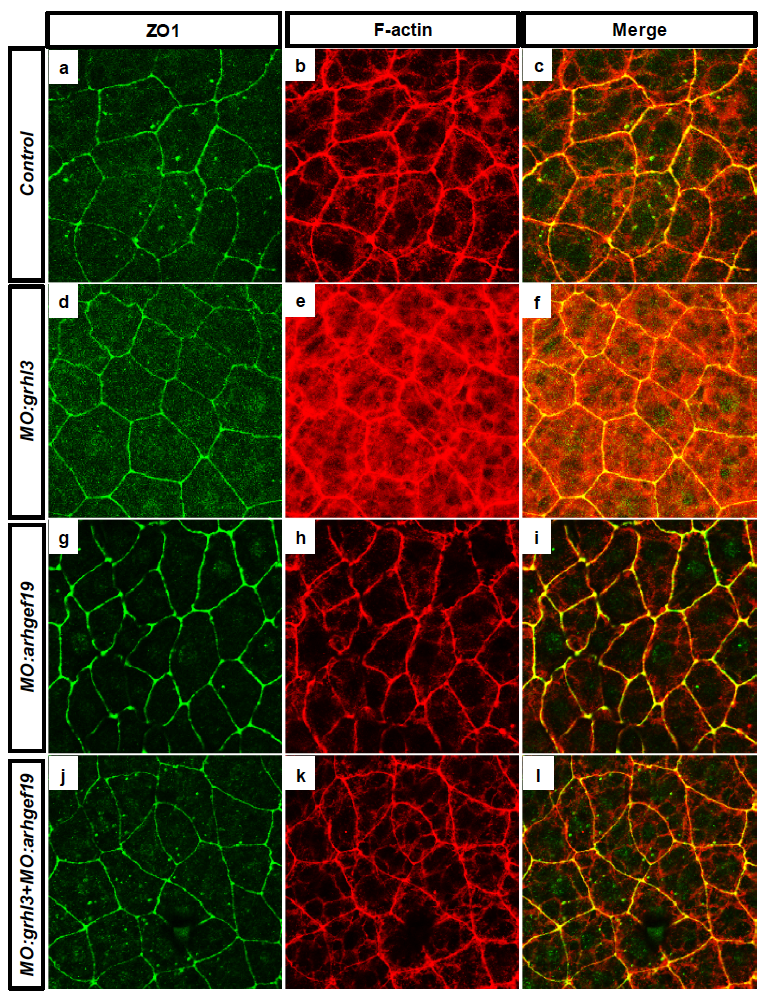
Fig. S4
Characterisation of tight junction formation following knockdown of grhl3 and arhgef19 at 8 hpf. (A-C) The expression of ZO1 (A) and actin (B) in the EVL (C; merged) of WT fish is unchanged following MO-mediated knockdown of grhl3 (D-F), arhgef19 (G-I) or both grhl3 and arhgef19 together (J-L) at 8 hpf.
Acknowledgments
This image is the copyrighted work of the attributed author or publisher, and
ZFIN has permission only to display this image to its users.
Additional permissions should be obtained from the applicable author or publisher of the image.
Full text @ Sci. Rep.