
|
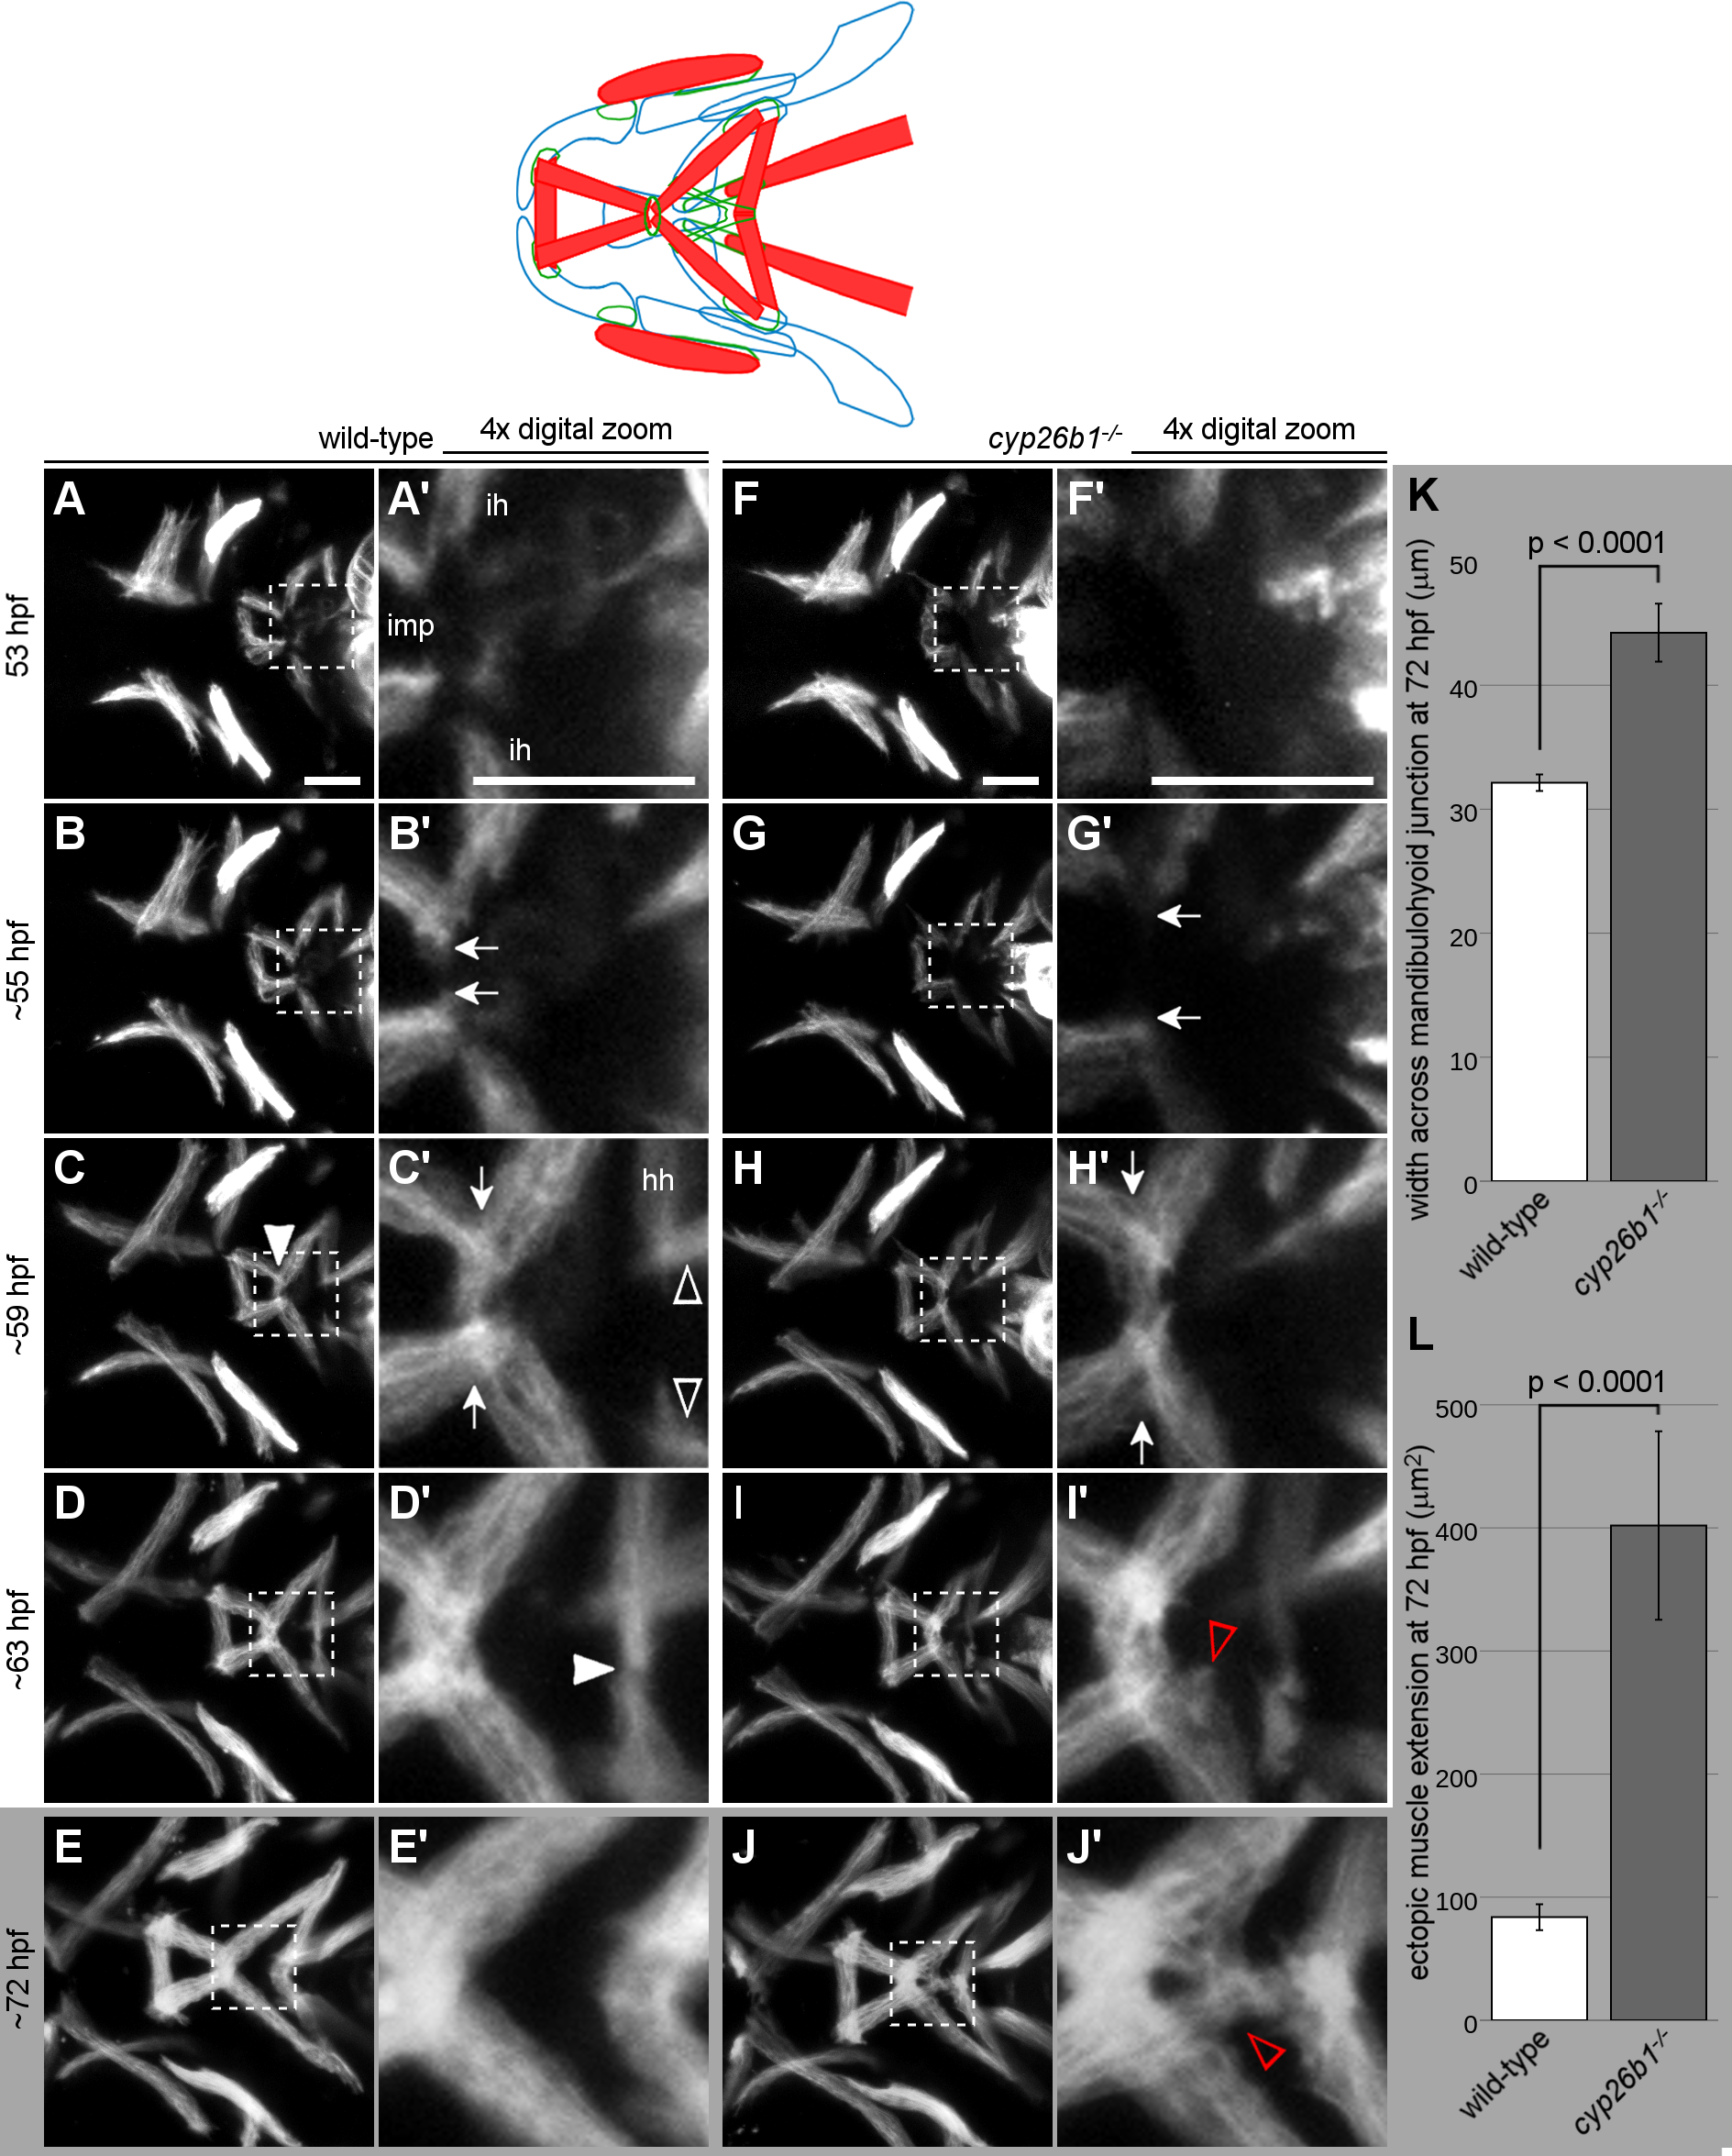
Fig. 3 Loss of Cyp26b1 function disrupts morphogenesis of the mandibulohyoid junction. (A-J) Stills from S1 Movie. (A) All first and second pharyngeal arch muscles are present at 53 hpf. (A’) Interhyal muscles (ih) extend toward the second pharyngeal arch midline while the intermandibularis posterior muscles (imp) extend from the first arch to the anterior edge of the second arch. (B,B’) Around 55 hpf, the tips of intermandibularis posterior and interhyal muscles on each side of the head connect (arrows). (C,C’) Before 60 hpf, the left and right sides meet in the midline, connecting the four muscles of the mandibulohyoid junction (arrowhead). (C’) Hyohyal muscles (hh) extend toward the second pharyngeal arch midline while the tips of sternohyoideus muscles pass just dorsally (arrowheads). (D,D’) Around 63 hpf, the hyohyal muscles meet end-to-end in the midline (arrowhead). (E,E’) At 72 hpf, now broader muscles sit end-to-end at the mandibulohyoid and hyohyal junctions. In cyp26b1 mutants, the timing of jaw muscle differentiation is normal (F,F’), but morphogenetic events are altered. (G,G’) Elongation toward the midline by intermandibularis posterior and interhyal muscles is slower (compare arrows to those in B’). (H,H’) The intermandibularis posterior and interhyal muscles connect poorly across the midline (distance between arrows = 46.5 μm, compare between arrows in C’ = 38.2 μm). (I,I’J,J’) Muscle fibers extend into the space bounded by the interhyal and hyohyal muscles (arrowheads). Both aberrant behaviors have phenotypic readouts at 72 hpf. (K) Where the muscles are narrowest at the junction between intermandibularis posterior and interhyal muscles (see arrows in C’,H’), the mandibulohyoid junction is significantly wider in mutants than in wild-type siblings. (L) There is also a significantly larger surface area in which the ends of intermandibularis posterior and interhyal muscles extend ectopically. All images ventral view, anterior to the left. Scale bar = 50 μm.