
|
Fig. 4
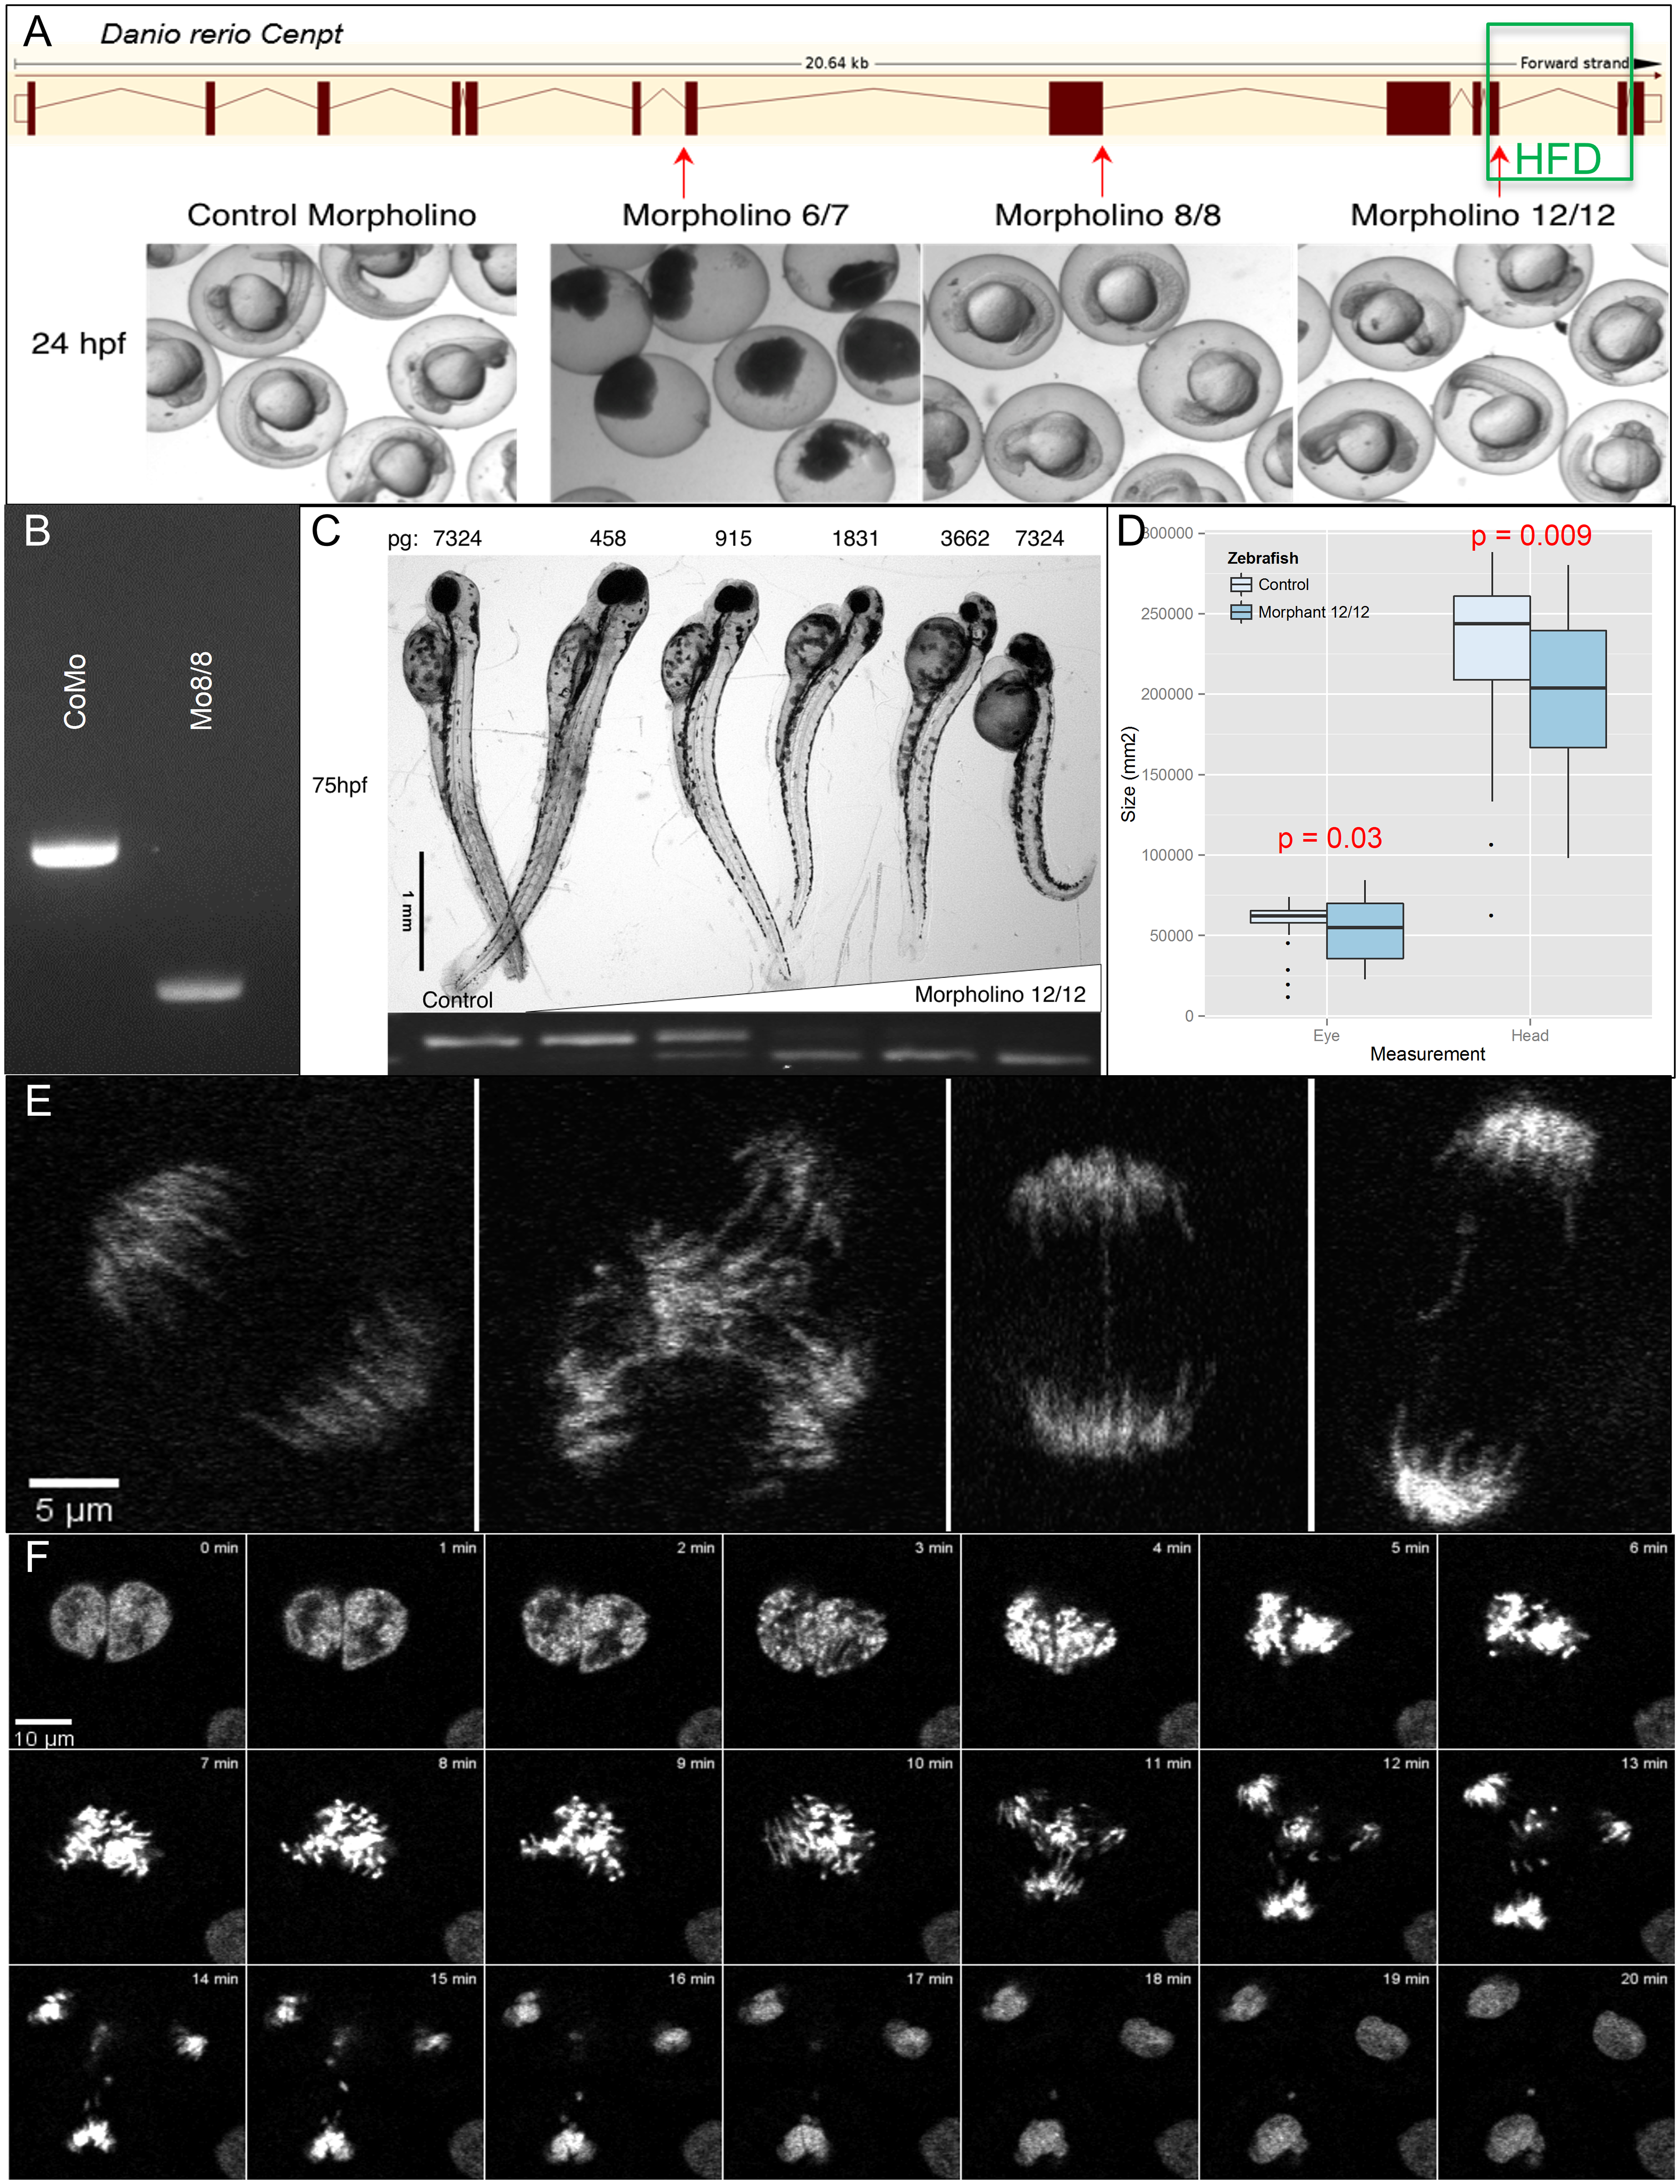
Knock-down zebrafish model.
(A) Comparison of morpholino target effects at 24hpf and localization of morpholino targets in relation to the zebrafish cenpt gene and the conserved histone-fold domain (HFD, green box). (B) Effect of Mo8 (Mo8/8) on transcription of zebrafish cenpt in comparison to control morpholino (CoMo). (C) Dose response curve of Mo12 (Mo12/12) at 75hpf. On the bottom RT-PCR of Mo12 dose response curve. The upper band represents the wild-type band. (D) Head and eye measurements in Mo12 injected zebrafish at 48hpf. (E) Left panel shows a normal mitosis. The three right panels are examples of mitotic aberrations seen in Mo12 injected Tg(h2afv:GFP) zebrafish live imaging. (F) Time lapse of aberrant mitosis in Mo12 injected Tg(h2afv:GFP) zebrafish.