
|
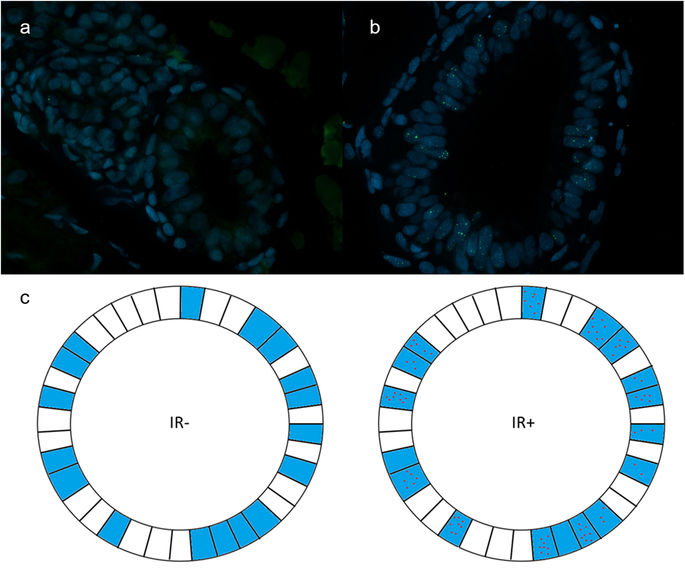
Fig. 2
Representative images of Rad51 staining. Rad51 foci are absent in unirradiated sample (a), while irradiated sample displays clear Rad51 foci (b) (green fluorescence). (c) Schematic drawing of an unirradiated (left) and irradiated (right) gut tube section. Cells in blue are in late S-/G2-phase and thus capable of HR. Cells in white are not capable of HR and will never show Rad51 foci. Red dots indicate Rad51 foci. Quantifying all cells would lead to a serious underestimation of your signal, due to the large proportion of non-HR capable cells. Instead, quantifying only cells containing foci will give a more true value for irradiated conditions. To estimate the amount of HR capable cells in unirradiated samples, one can extrapolate the percentage of cells that contain Rad51 foci from the irradiated samples.