
|
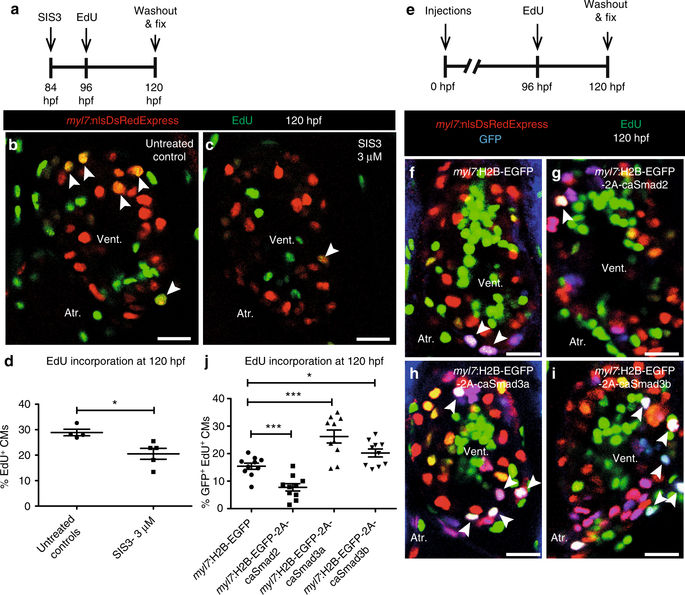
Fig. 6
CM proliferation is inversely regulated by Smad2 and Smad3. a Experimental setup of SIS3 treatment, followed by EdU treatment and fixation. b, c Tg(myl7:nlsDsRedExpress) hearts of untreated control and 3 µM SIS3-treated larvae at 120 hpf; α-DsRed (red), EdU (green). White arrowheads point to proliferating CMs (EdU+/DsRed+). d Quantification of CM proliferation in untreated control (n = 4) and 3 µM SIS3-treated (n = 5) ventricles at 120 hpf. e Experimental setup of injections, followed by EdU treatment and fixation. f–i Tg(myl7:nlsDsRedExpress) hearts of myl7:H2B-EGFP, myl7:H2B-EGFP-2A-caSmad2, myl7:H2B-EGFP-2A-caSmad3a and myl7:H2B-EGFP-2A-caSmad3b injected larvae at 120 hpf; α-DsRed (red), α-GFP (blue), EdU (green). White arrowheads point to proliferating CMs (EdU+/DsRed+/GFP +). j Quantification of CM proliferation in myl7:H2B-EGFP (n = 10), caSmad2 (n = 10), caSmad3a (n = 10), and caSmad3b (n = 10) injected ventricles at 120 hpf. All cell counts were performed on non-overlapping confocal planes (thickness, 1 µm) (data are mean ± s.e.m., *P ≤ 0.05 and ***P ≤ 0.001—Student’s t test, two-tailed). Scale bars, 20 µm. vent., ventricle; atr., atrium