
|
Fig. 2
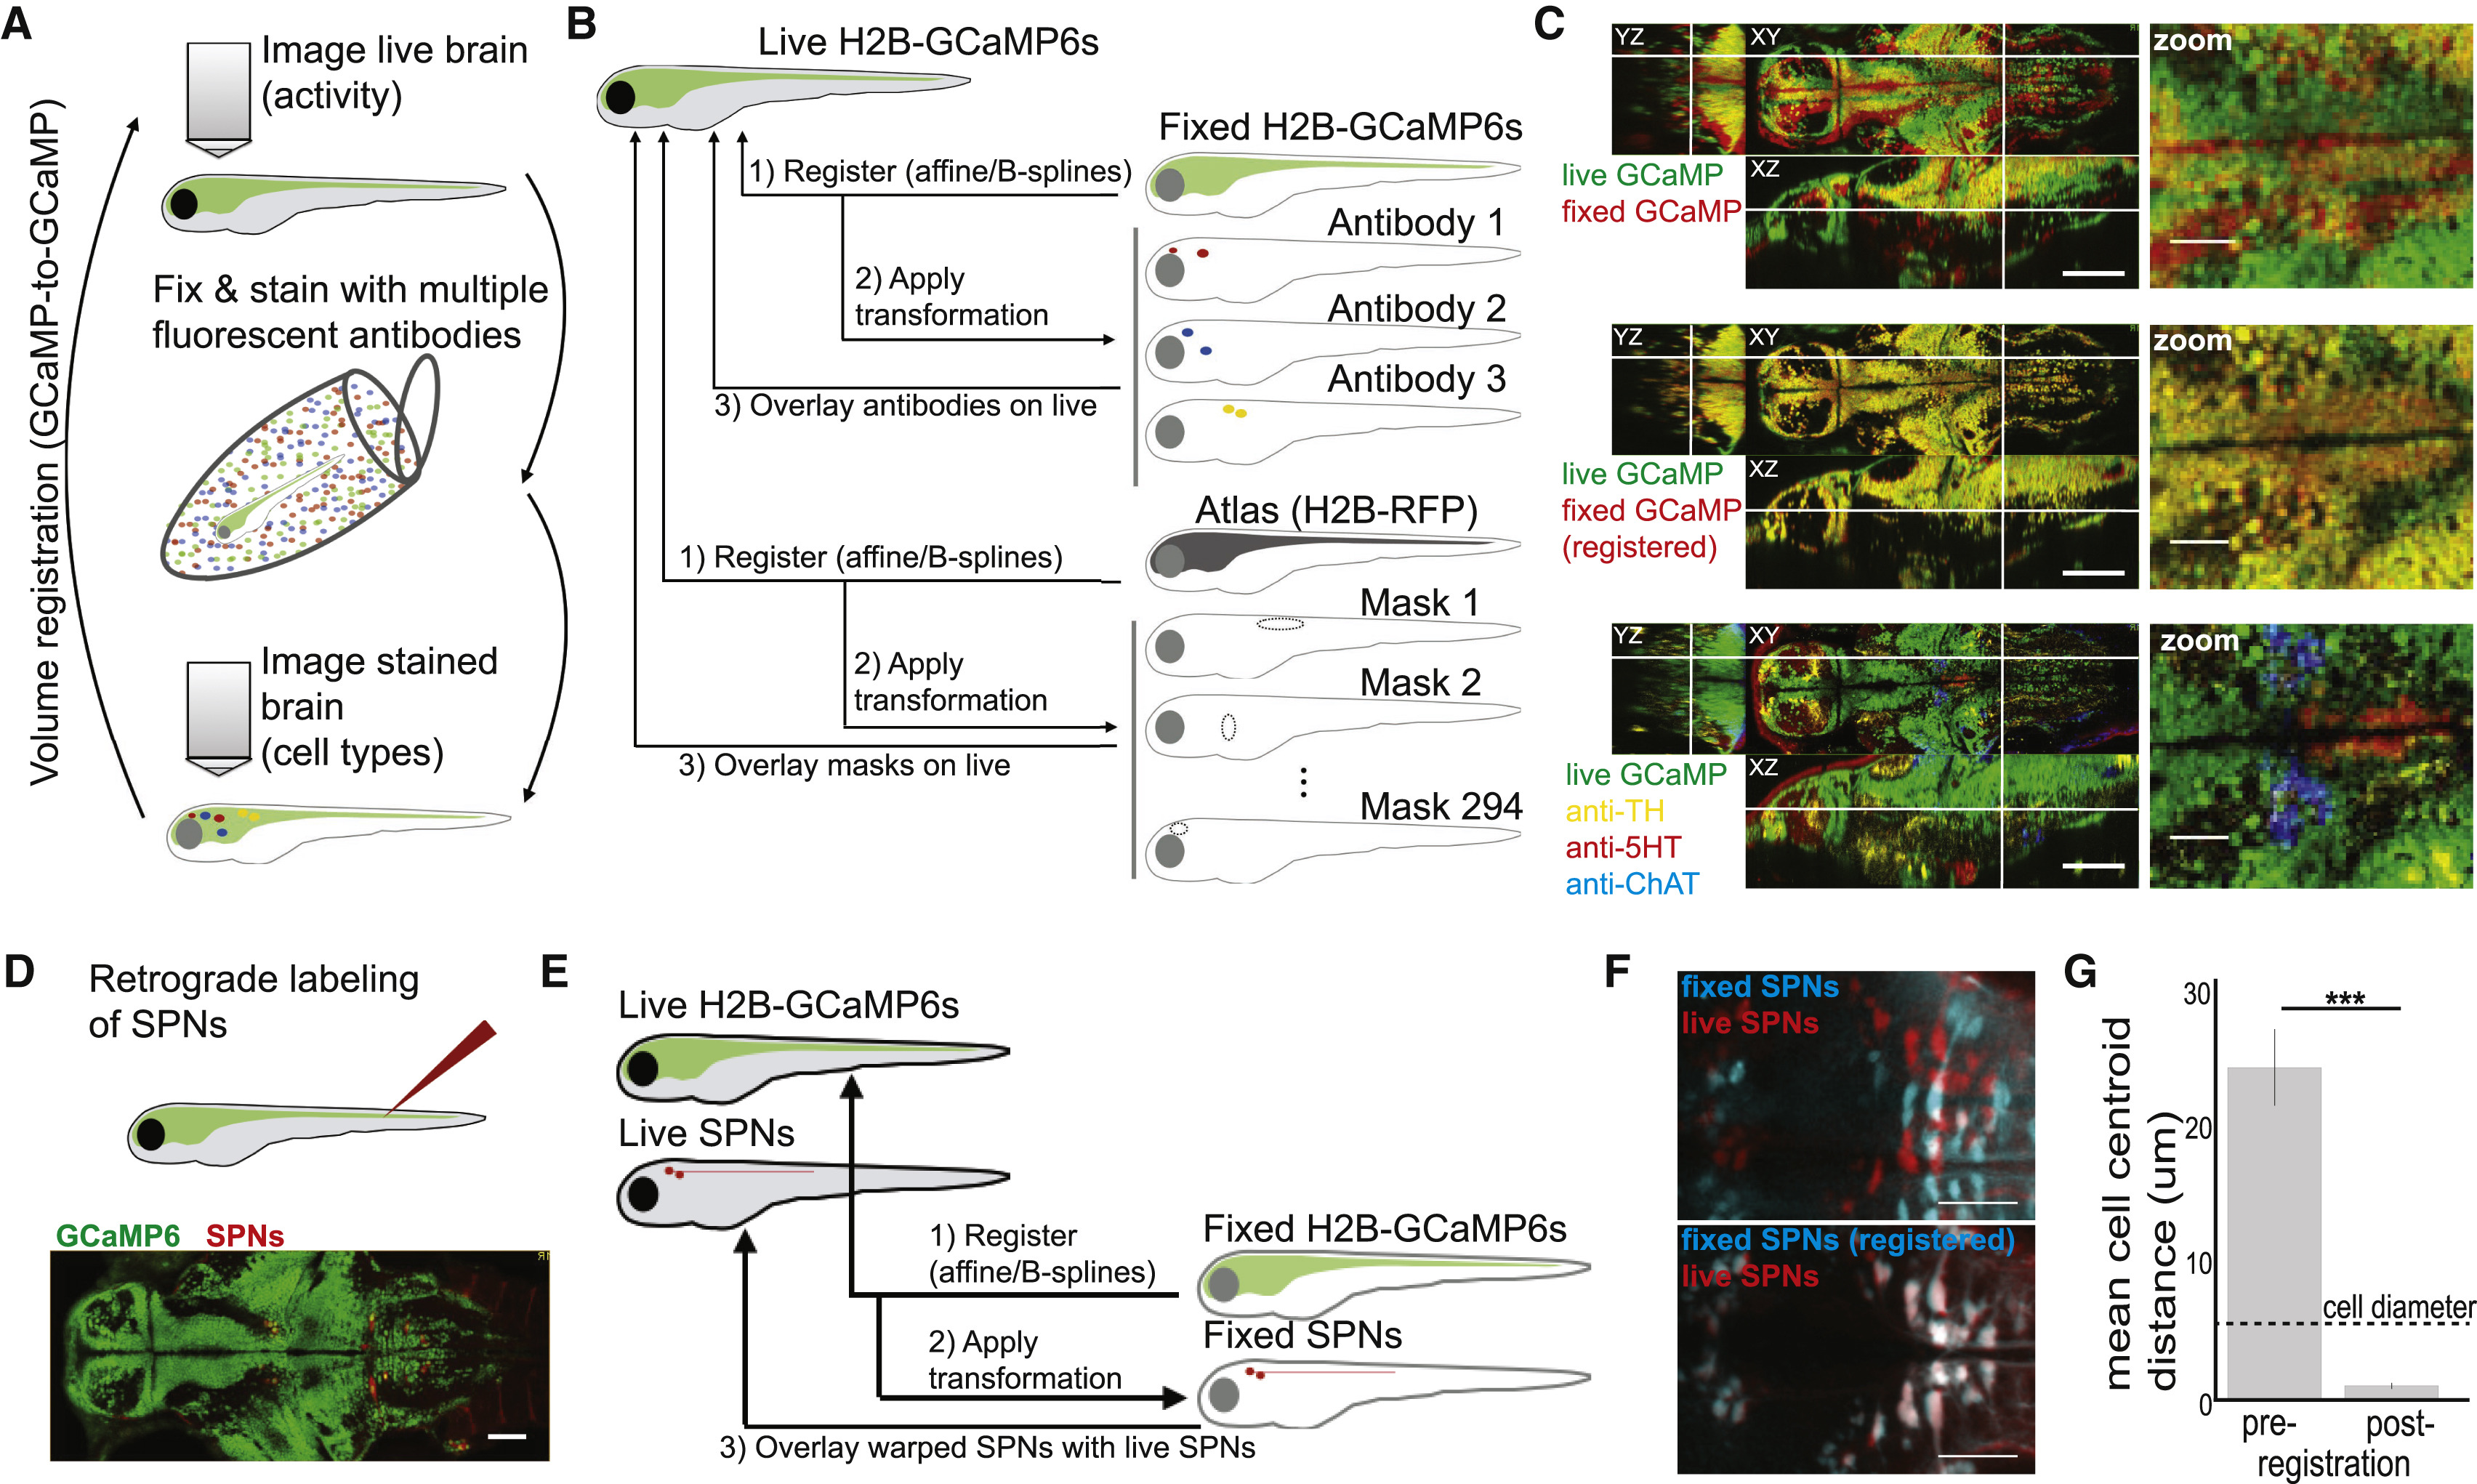
Whole-Brain Cellular-Resolution Registration of Activity and Molecular Features with MultiMAP
(A) Schematic of sample-handling pipeline.
(B) Schematic of data-handling pipeline.
(C) Orthogonal planes (XY, YZ, and XZ) and x,y zoom of signal overlays from a single fish. White lines indicate location of cross section. The cell types at bottom right are the cholinergic tegmentum (cyan), the serotonergic dorsal raphe nucleus (red), and the noradrenergic locus coeruleus (yellow). Scale bars: 100 μm (left) and 25 μm (right). See Figure S2 and Movie S1 for additional details and examples.
(D) Spinal projection neurons (SPNs) in Tg(elavl3:H2B-GCaMP6s) fish are back-labeled through injection of Texas Red Dextran. Scale bar: 50 μm.
(E) Schematic of data-handling pipeline, where GCaMP volumes are used for registration, and co-imaged SPN volumes are used to assess accuracy.
(F) Z-projections through the midbrain and hindbrain of live (red) and fixed (cyan) SPN samples are overlaid before (top) or after (bottom) registration of GCaMP volumes. Scale bar: 50 μm.
(G) Mean distance between matched cell centers (STAR Methods) before and after registration.
Bars are mean ± SEM. Two-tailed Wilcoxon signed-rank test, n = 4 fish. ∗∗∗p < 0.001. See also Figure S2, Movie S1, and STAR Methods.
Reprinted from Cell, 171(6), Lovett-Barron, M., Andalman, A.S., Allen, W.E., Vesuna, S., Kauvar, I., Burns, V.M., Deisseroth, K., Ancestral Circuits for the Coordinated Modulation of Brain State, 1411-1423.e17, Copyright (2017) with permission from Elsevier. Full text @ Cell