
|
Fig. S1
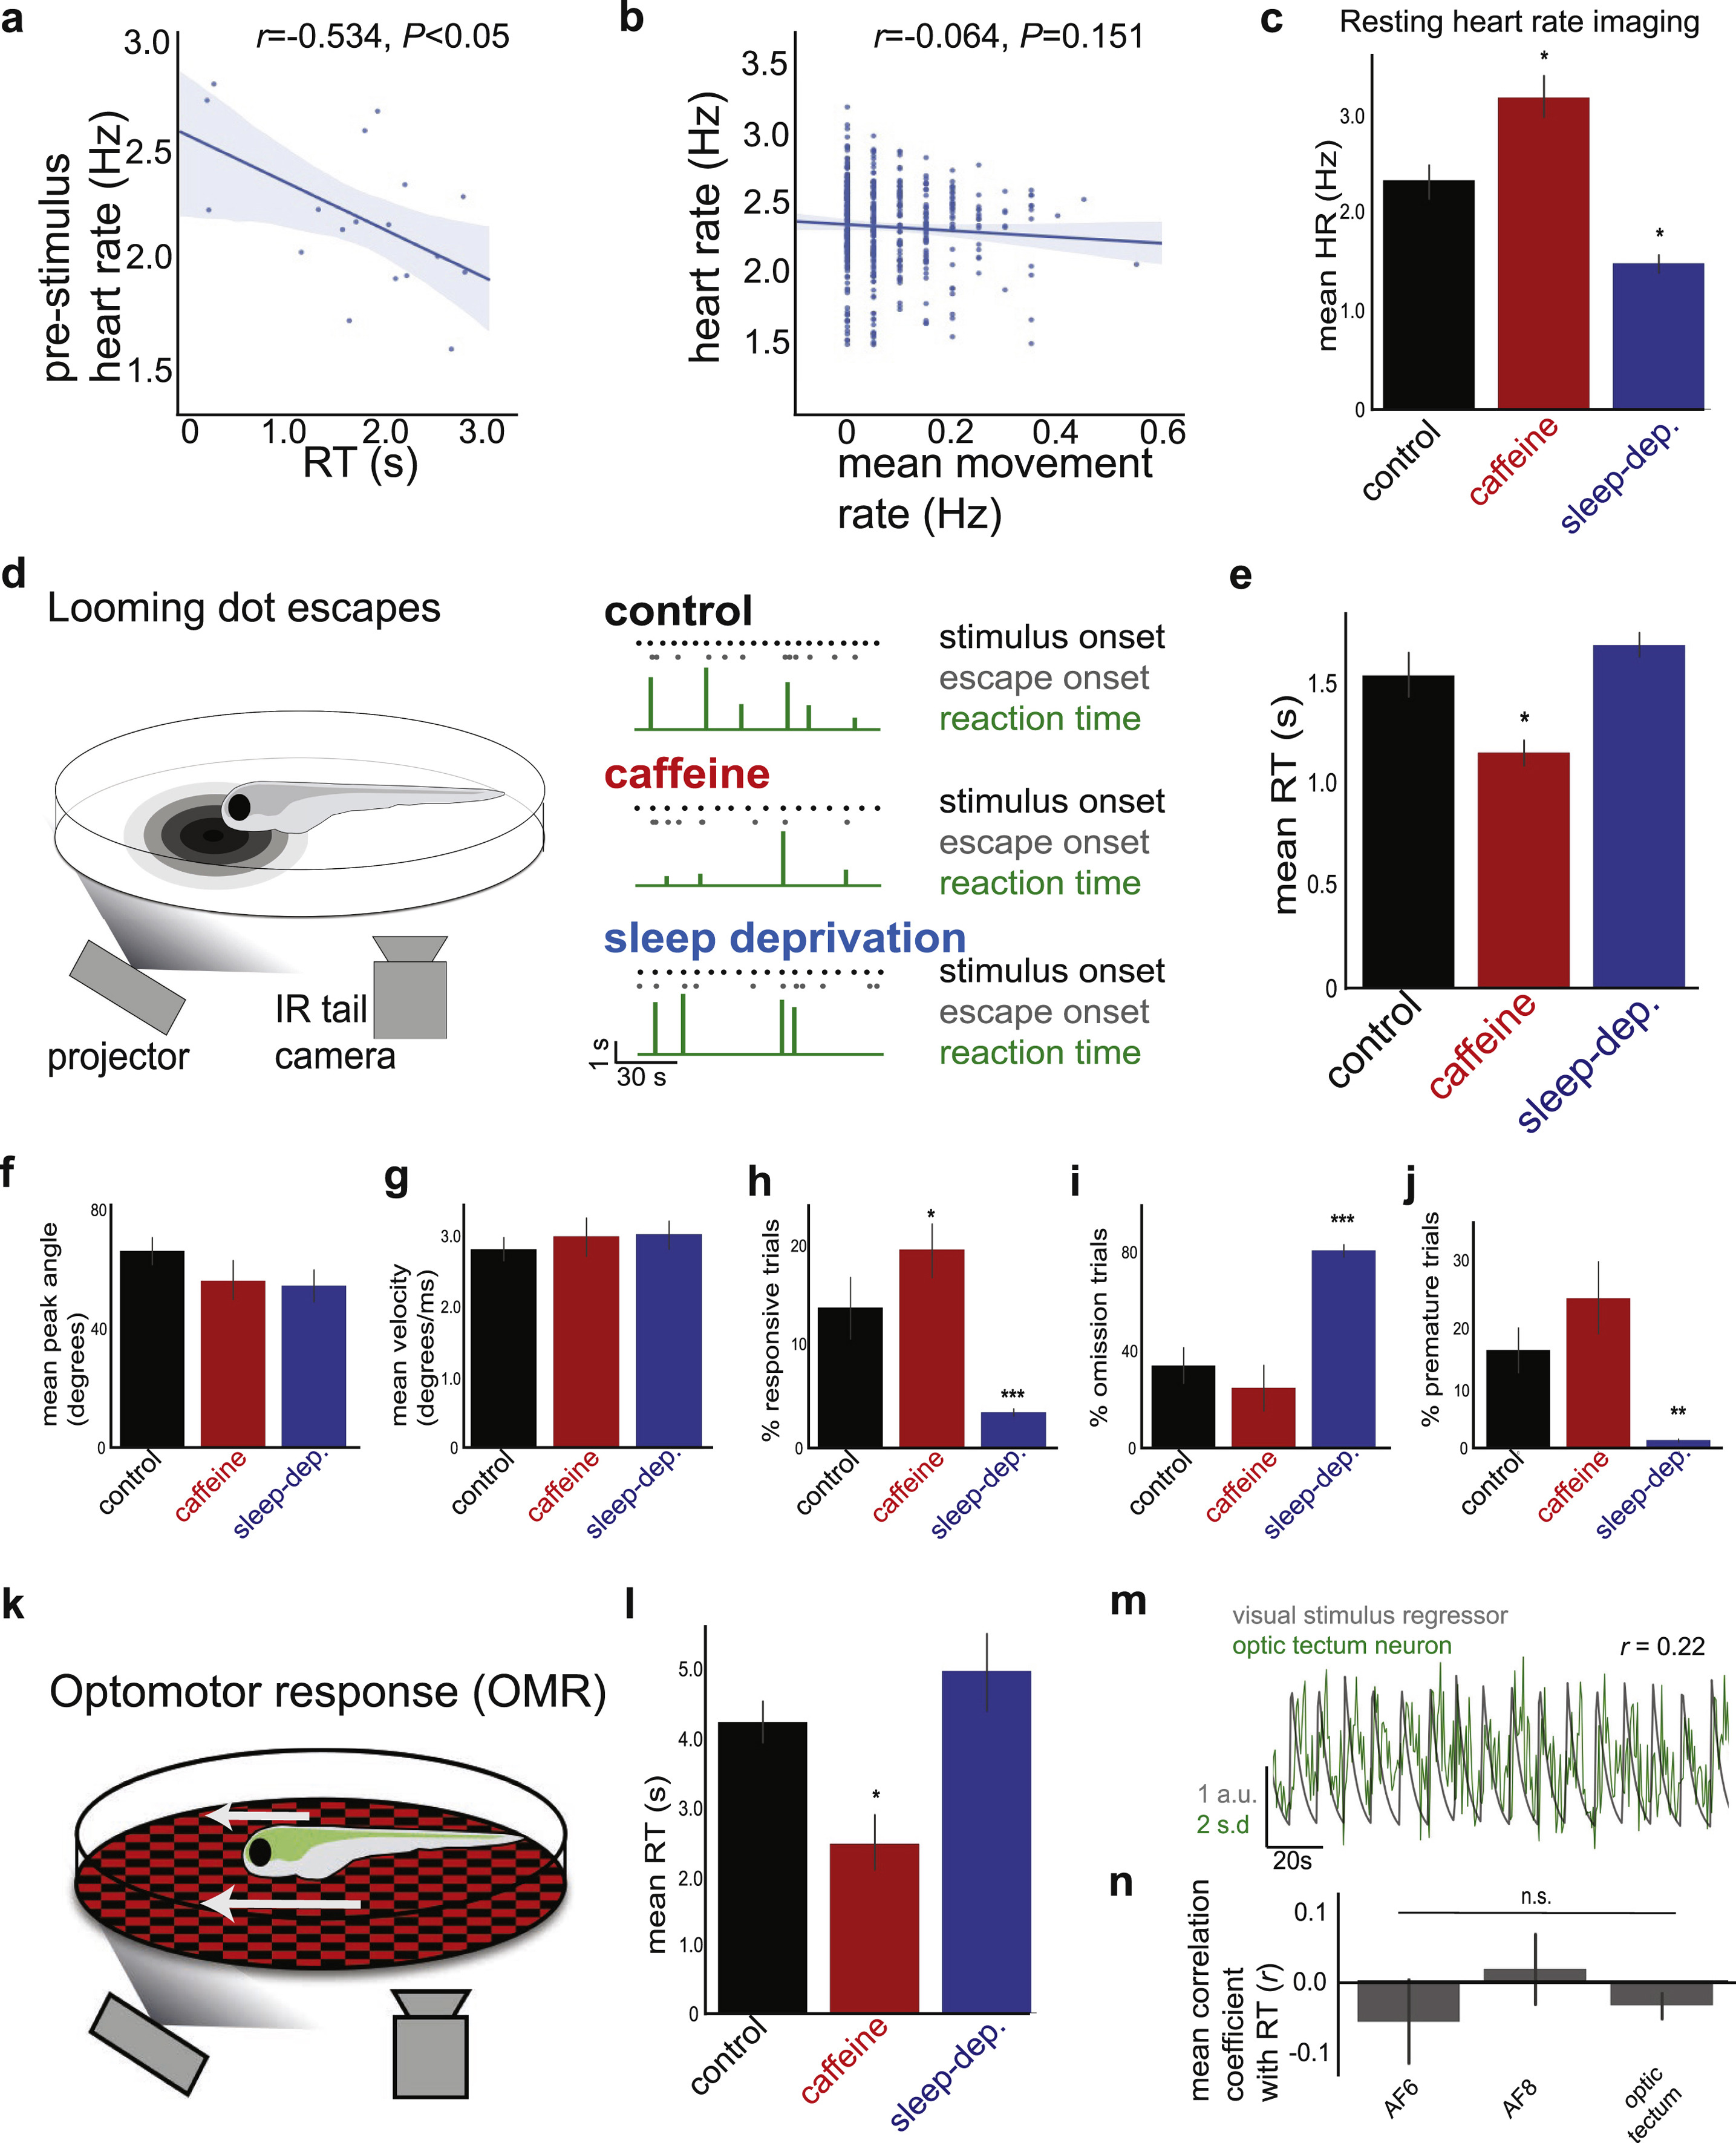
Reaction Time Is a Measure of Internally Generated Alertness States, Related to Figure 1
(A) Correlation between pre-stimulus heart rate and RT in an example fish (r = −0.534, p < 0.05). Heart rate tends to be higher before fast RTs (high alertness) and tends to be lower before slow RTs (low alertness). See Figure 1E for summary data. Solid line = linear regression; shaded region = 95% confidence interval.
(B) Summary data, showing no significant correlation between heart rate and total movement rate in 20 s bins (r = −0.064, p > 0.05, n = 6).
(C) Effects of caffeine and sleep deprivation on resting heart rate, imaged in fully embedded fish. n = 6, 4, and 4 (control, caffeine, and sleep-deprivation, respectively). One-way ANOVA, F(2,13) = 16.41, p < 0.001. Two-sided t tests with control, ∗p < 0.05.
(D) Left: Schematic of zebrafish looming dot RT behavior. Right: Example behavioral recordings over 2 minutes. Each fish is either control (no treatment), treated with 50 mg/L caffeine, or subjected to one night of sleep deprivation. Note that control fish display variability in RTs, whereas fish with potentiated alertness (caffeine) have faster RTs and fish with suppressed alertness (sleep deprivation) have slower RTs.
(E) Summary data for control fish (n = 16, black), fish treated with 50 mg/L caffeine (n = 8, red), and fish deprived of sleep for one night (n = 10, blue). Mean ± SEM. Kruskal-Wallis test, H = 10.67, p < 0.005, Mann-Whitney rank tests with control. ∗p < 0.05.
(F–J) Data from the same fish in panel e. All data are mean ± SEM. (F) Summary data for peak tail angle. Kruskal-Wallis test, H = 3.75, p > 0.05. (G) Summary data for peak tail velocity. Kruskal-Wallis test, H = 1.30, p > 0.05. (H) Summary data for % responsive trials. Kruskal-Wallis test, H = 20.46, p < 0.001. Mann-Whitney rank tests with control. ∗p < 0.05, ∗∗∗p < 0.001. (I) Summary data for % omitted trials. Kruskal-Wallis test, H = 17.95, p < 0.001. Mann-Whitney rank tests with control, ∗∗∗p < 0.001. (J) Summary data for % premature response trials. Kruskal-Wallis test, H = 14.88, p < 0.001. Mann-Whitney rank tests with control, ∗∗p < 0.01. Caffeine does not significantly increase the premature response rate.
(K) Schematic of zebrafish optomotor response (OMR) behavior.
(L) Summary data. Mean ± SEM. Kruskal-Wallis test, H = 7.56, p < 0.05, Mann-Whitney rank tests with control. ∗p < 0.05.
(M and N) Visual stimulus-correlated neurons in looming-related sensory regions do not show stimulus responses correlated to RT. (M) Example neuron correlated to visual stimulus regressor, recorded with 2-photon imaging (STAR Methods). (N) Summary data for visual-correlated neurons in each looming-associated visual region (AF: retinal arborization field). n = 12, 23, and 217 cells (left to right). Significance values determined by one-sample Wilcoxon signed-rank tests and false discovery rate correction for multiple comparisons. Mean ± SEM. All summary data are grouped by fish.
Reprinted from Cell, 171(6), Lovett-Barron, M., Andalman, A.S., Allen, W.E., Vesuna, S., Kauvar, I., Burns, V.M., Deisseroth, K., Ancestral Circuits for the Coordinated Modulation of Brain State, 1411-1423.e17, Copyright (2017) with permission from Elsevier. Full text @ Cell