
|
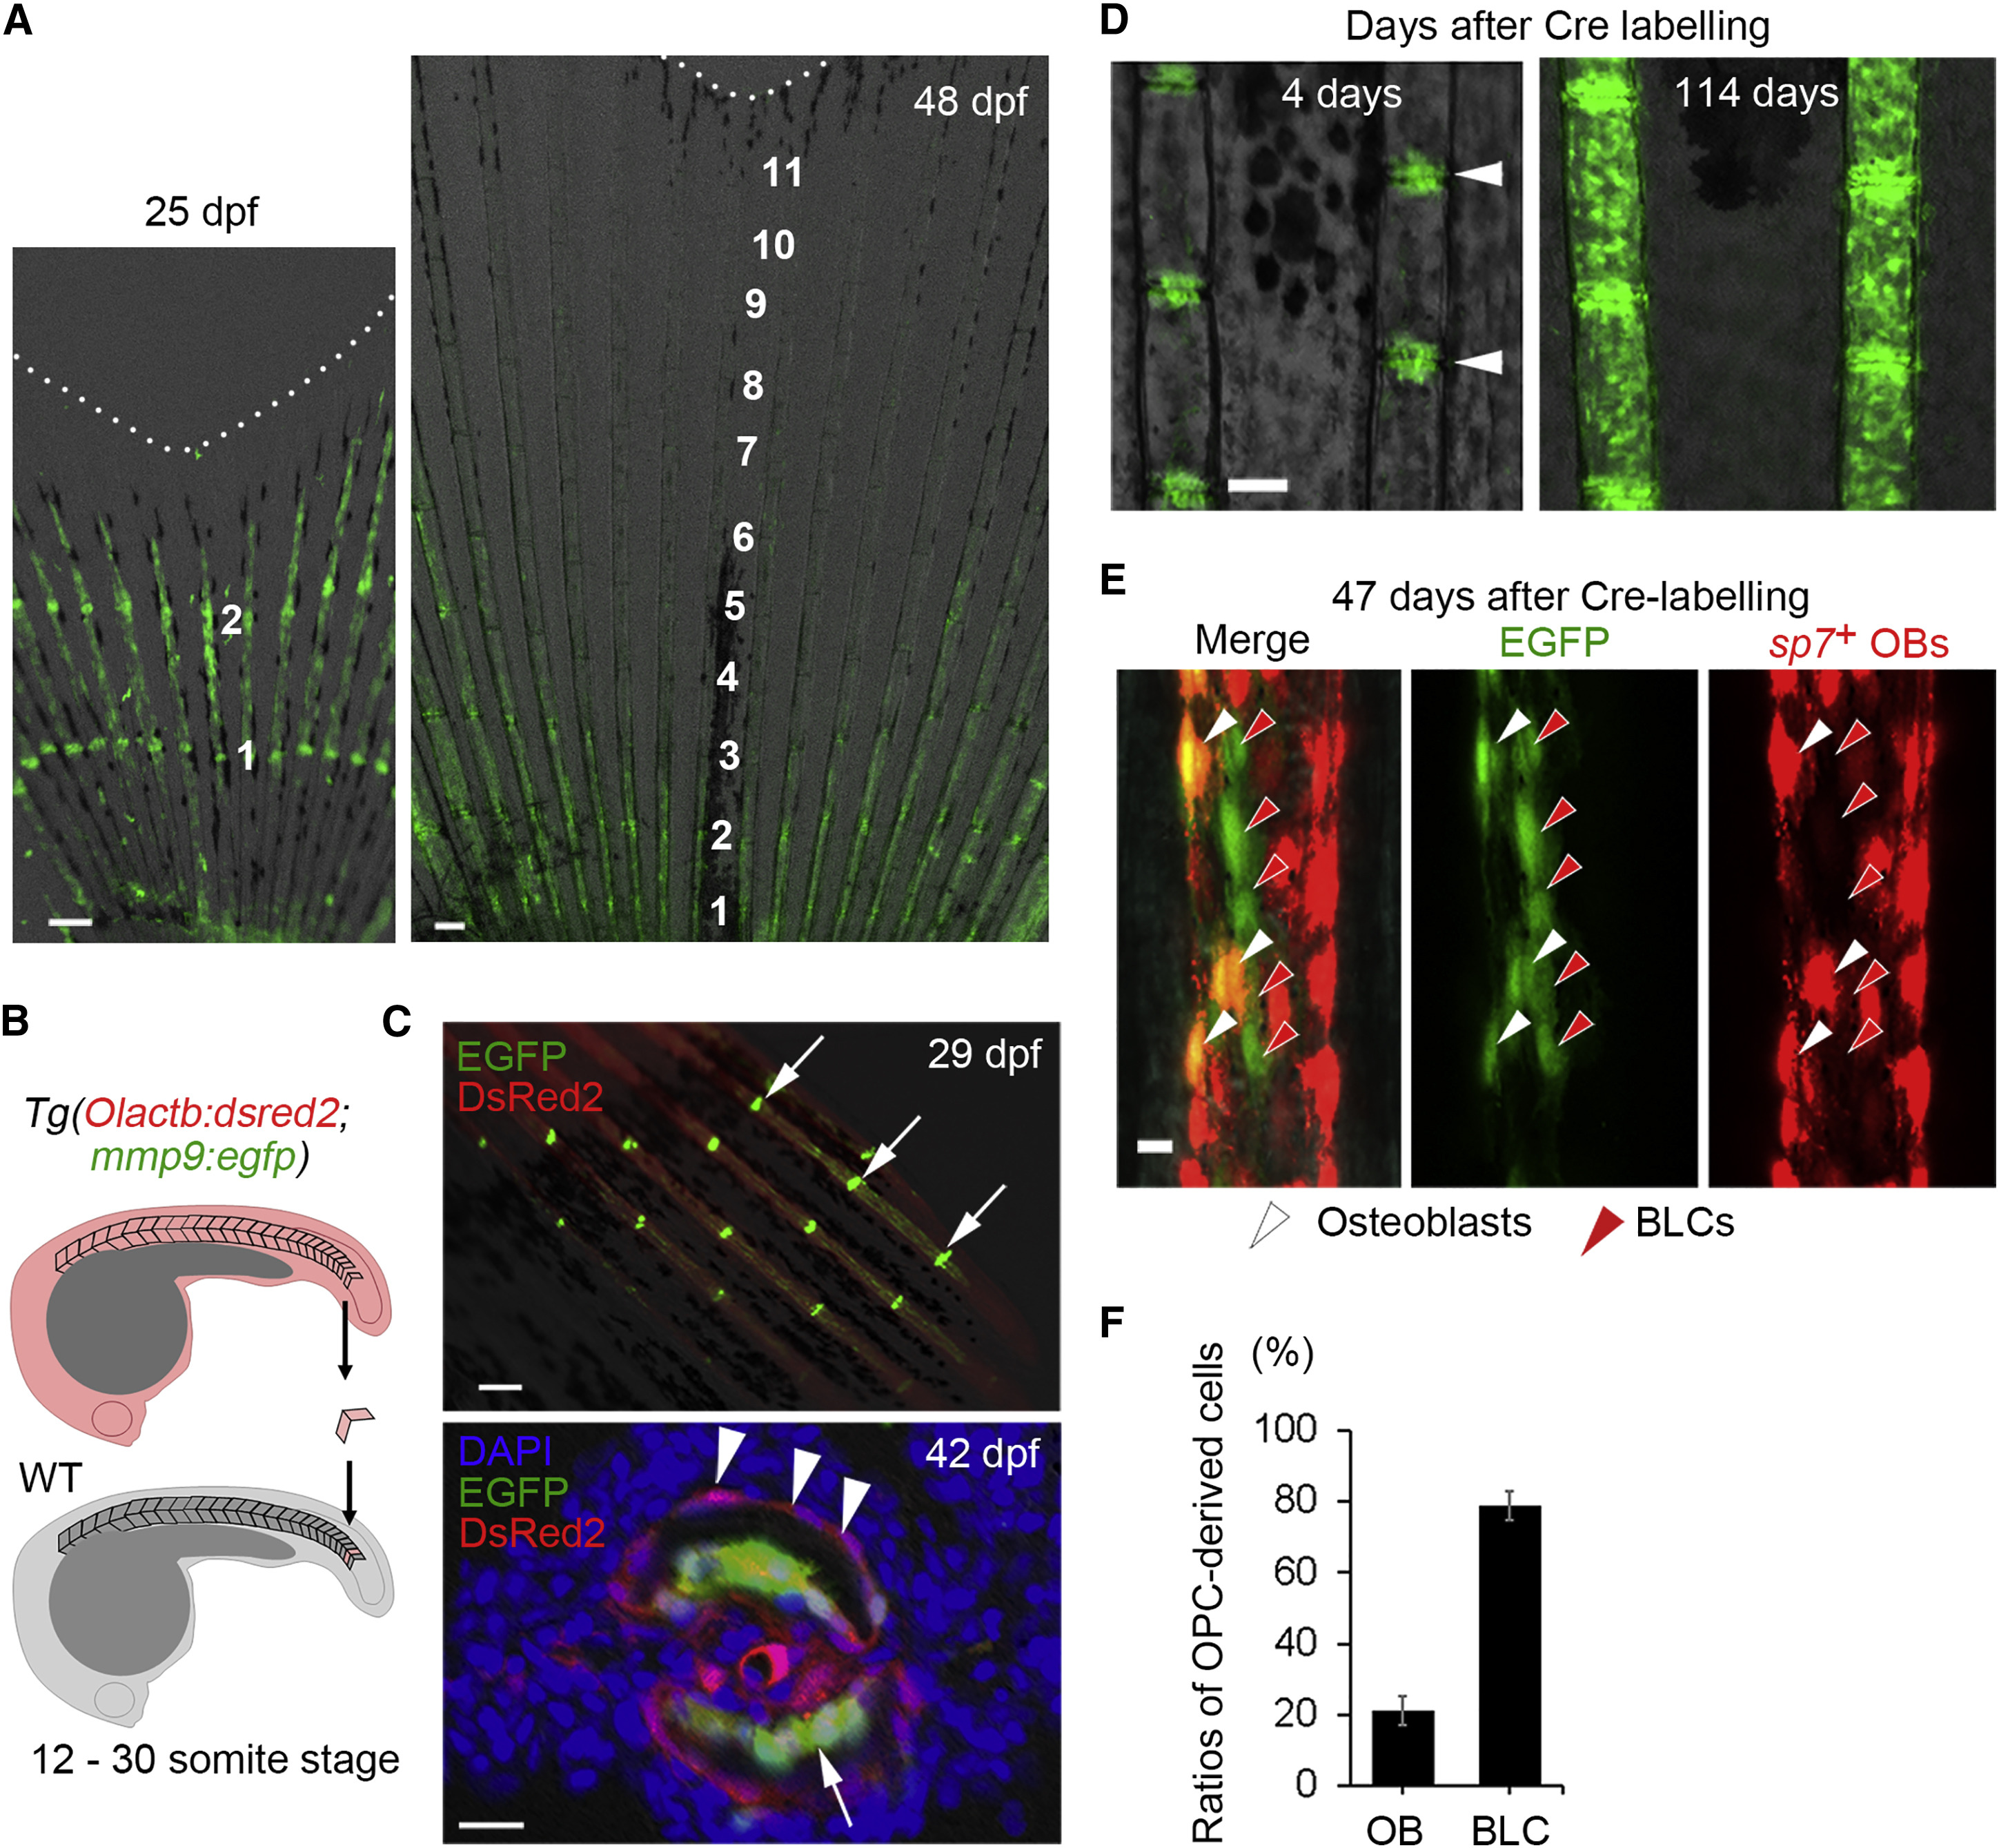
Fig. 4 Origin and Development of OPCs and Their Role in Osteoblast Maintenance (A) Tracing of early OPCs labeled at 25 dpf. Progenies of Cre-labeled OPCs contributed to neither newly added OPCs nor osteoblasts in the distal regions (n = 9 of 9 fish), suggesting that OPCs are produced by non-OPC precursor cells. Numbers denote fin ray joints. Scale bars, 100 μm. (B) A diagram of somite transplantation. Somites that ubiquitously expressed DsRed2 were taken from double Tg(mmp9:egfp; Olactb:loxP-dsred2-loxP-egfp) and transplanted into WT. (C) Differentiation of somite-derived cells into OPCs in fin ray joints. Upper panel: whole-mount view of the fin; lower panel: a section through the fin ray joint. As in a previous study in medaka fish (Shimada et al., 2013), the somite-derived cells (DsRed2+) contributed to mesenchymal cells and osteoblasts in fin rays. Significantly, the somite-derived cells also differentiated into the EGFP+ joint OPCs in 5 of 5 successful transplantations, strongly suggesting that OPCs are derived from the somites. Arrows, OPCs; arrowheads, osteoblasts or BLCs derived from transplanted somite. Nuclei, DAPI. Scale bars, 100 μm (upper panel) and 10 μm (lower panel). (D) Fluorescent stereomicroscope images of EGFP+ cells at 4 days and 114 days after Cre-loxP recombination. Joint OPCs (arrowheads) were labeled by Cre recombination at 4 months of age. Labeled OPCs gradually differentiated into cells on the surfaces of fin rays. Scale bar, 100 μm. (E) Confocal z-stack image of progenies of Cre-labeled joint OPCs in adult fish that also carry the sp7:mcherry transgene. Progenies of OPCs in uninjured adult fins contain both mCherry+ (sp7-expressing) osteoblasts (white arrowheads) and mCherry− BLCs (red arrowheads), which distribute in the non-joint region. Scale bar, 10 μm. (F) Ratios of OPC-derived osteoblasts (OBs) and BLCs in non-regenerating fin rays. Cells were counted in a fin ray segment of the central fin region in each fish. Error bars indicate mean ± SEM (n = 5 fish).
Reprinted from Developmental Cell, 43(5), Ando, K., Shibata, E., Hans, S., Brand, M., Kawakami, A., Osteoblast Production by Reserved Progenitor Cells in Zebrafish Bone Regeneration and Maintenance, 643-650.e3, Copyright (2017) with permission from Elsevier. Full text @ Dev. Cell