
|
Fig. 2
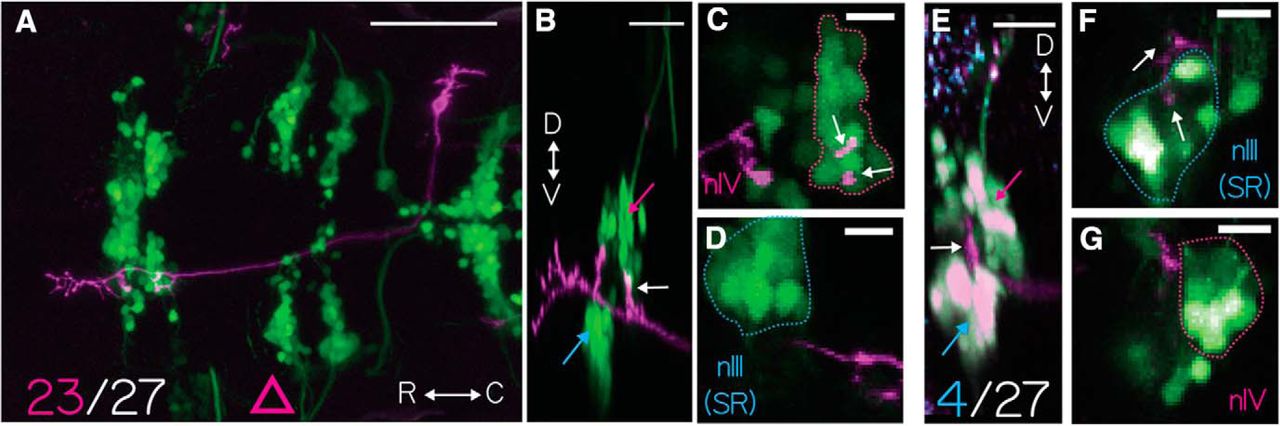
Projections from singly labeled vestibular nucleus neurons. A, Horizontal MIP of a single vestibular neuron labeled with UAS-ChR2(H134R)-EYFP (purple) in Tg(−6.7FRhcrtR:gal4VP16);Tg(isl:GFP) (green). γ = 0.5 to highlight the sparse label. Scale bar, 100 μm. Pink triangle represents the data in Figure 7D. Twenty-three of 27 neurons studied projected similarly. B, Sagittal MIP of the neuron in A highlighting nIII (cyan arrow), nIV (magenta arrow), and projection to nIV (white arrow). Scale bar, 20 μm. C, Horizontal MIP of nIV (green cell bodies in dotted magenta outline) from A. Vestibular neuron projection (purple, white arrow). Scale bar, 10 μm. D, Horizontal MIP of nIII (green cell bodies in dotted cyan outline) with no proximal vestibular neuron projection (purple). E, Sagittal MIP of a single axon expressing 14×UAS-E1b:hChR2(H134R)-EYFP (purple) in Tg(−6.7FRhcrtR:gal4VP16);Tg(isl1:GFP) (green); Tg(atoh7:gap43-RFP) (cyan) fish. Expression of bright GFP bleeds into the purple channel, making the cell bodies white. nIV (magenta arrow), nIII (cyan arrow), and the vestibular neuron projection to SR motoneurons in nIII (white arrow). Scale bar, 20 μm. Four of 27 neurons projected similarly, exclusively to nIII. F, Horizontal MIP of nIII (cells in blue outline) from E, purple projections from vestibular neuron (white arrow). Scale bar, 10 μm. G, Horizontal MIP of nIV (cells in magenta outline) from E with no purple vestibular neuron projection. Scale bar, 10 μm.