
|
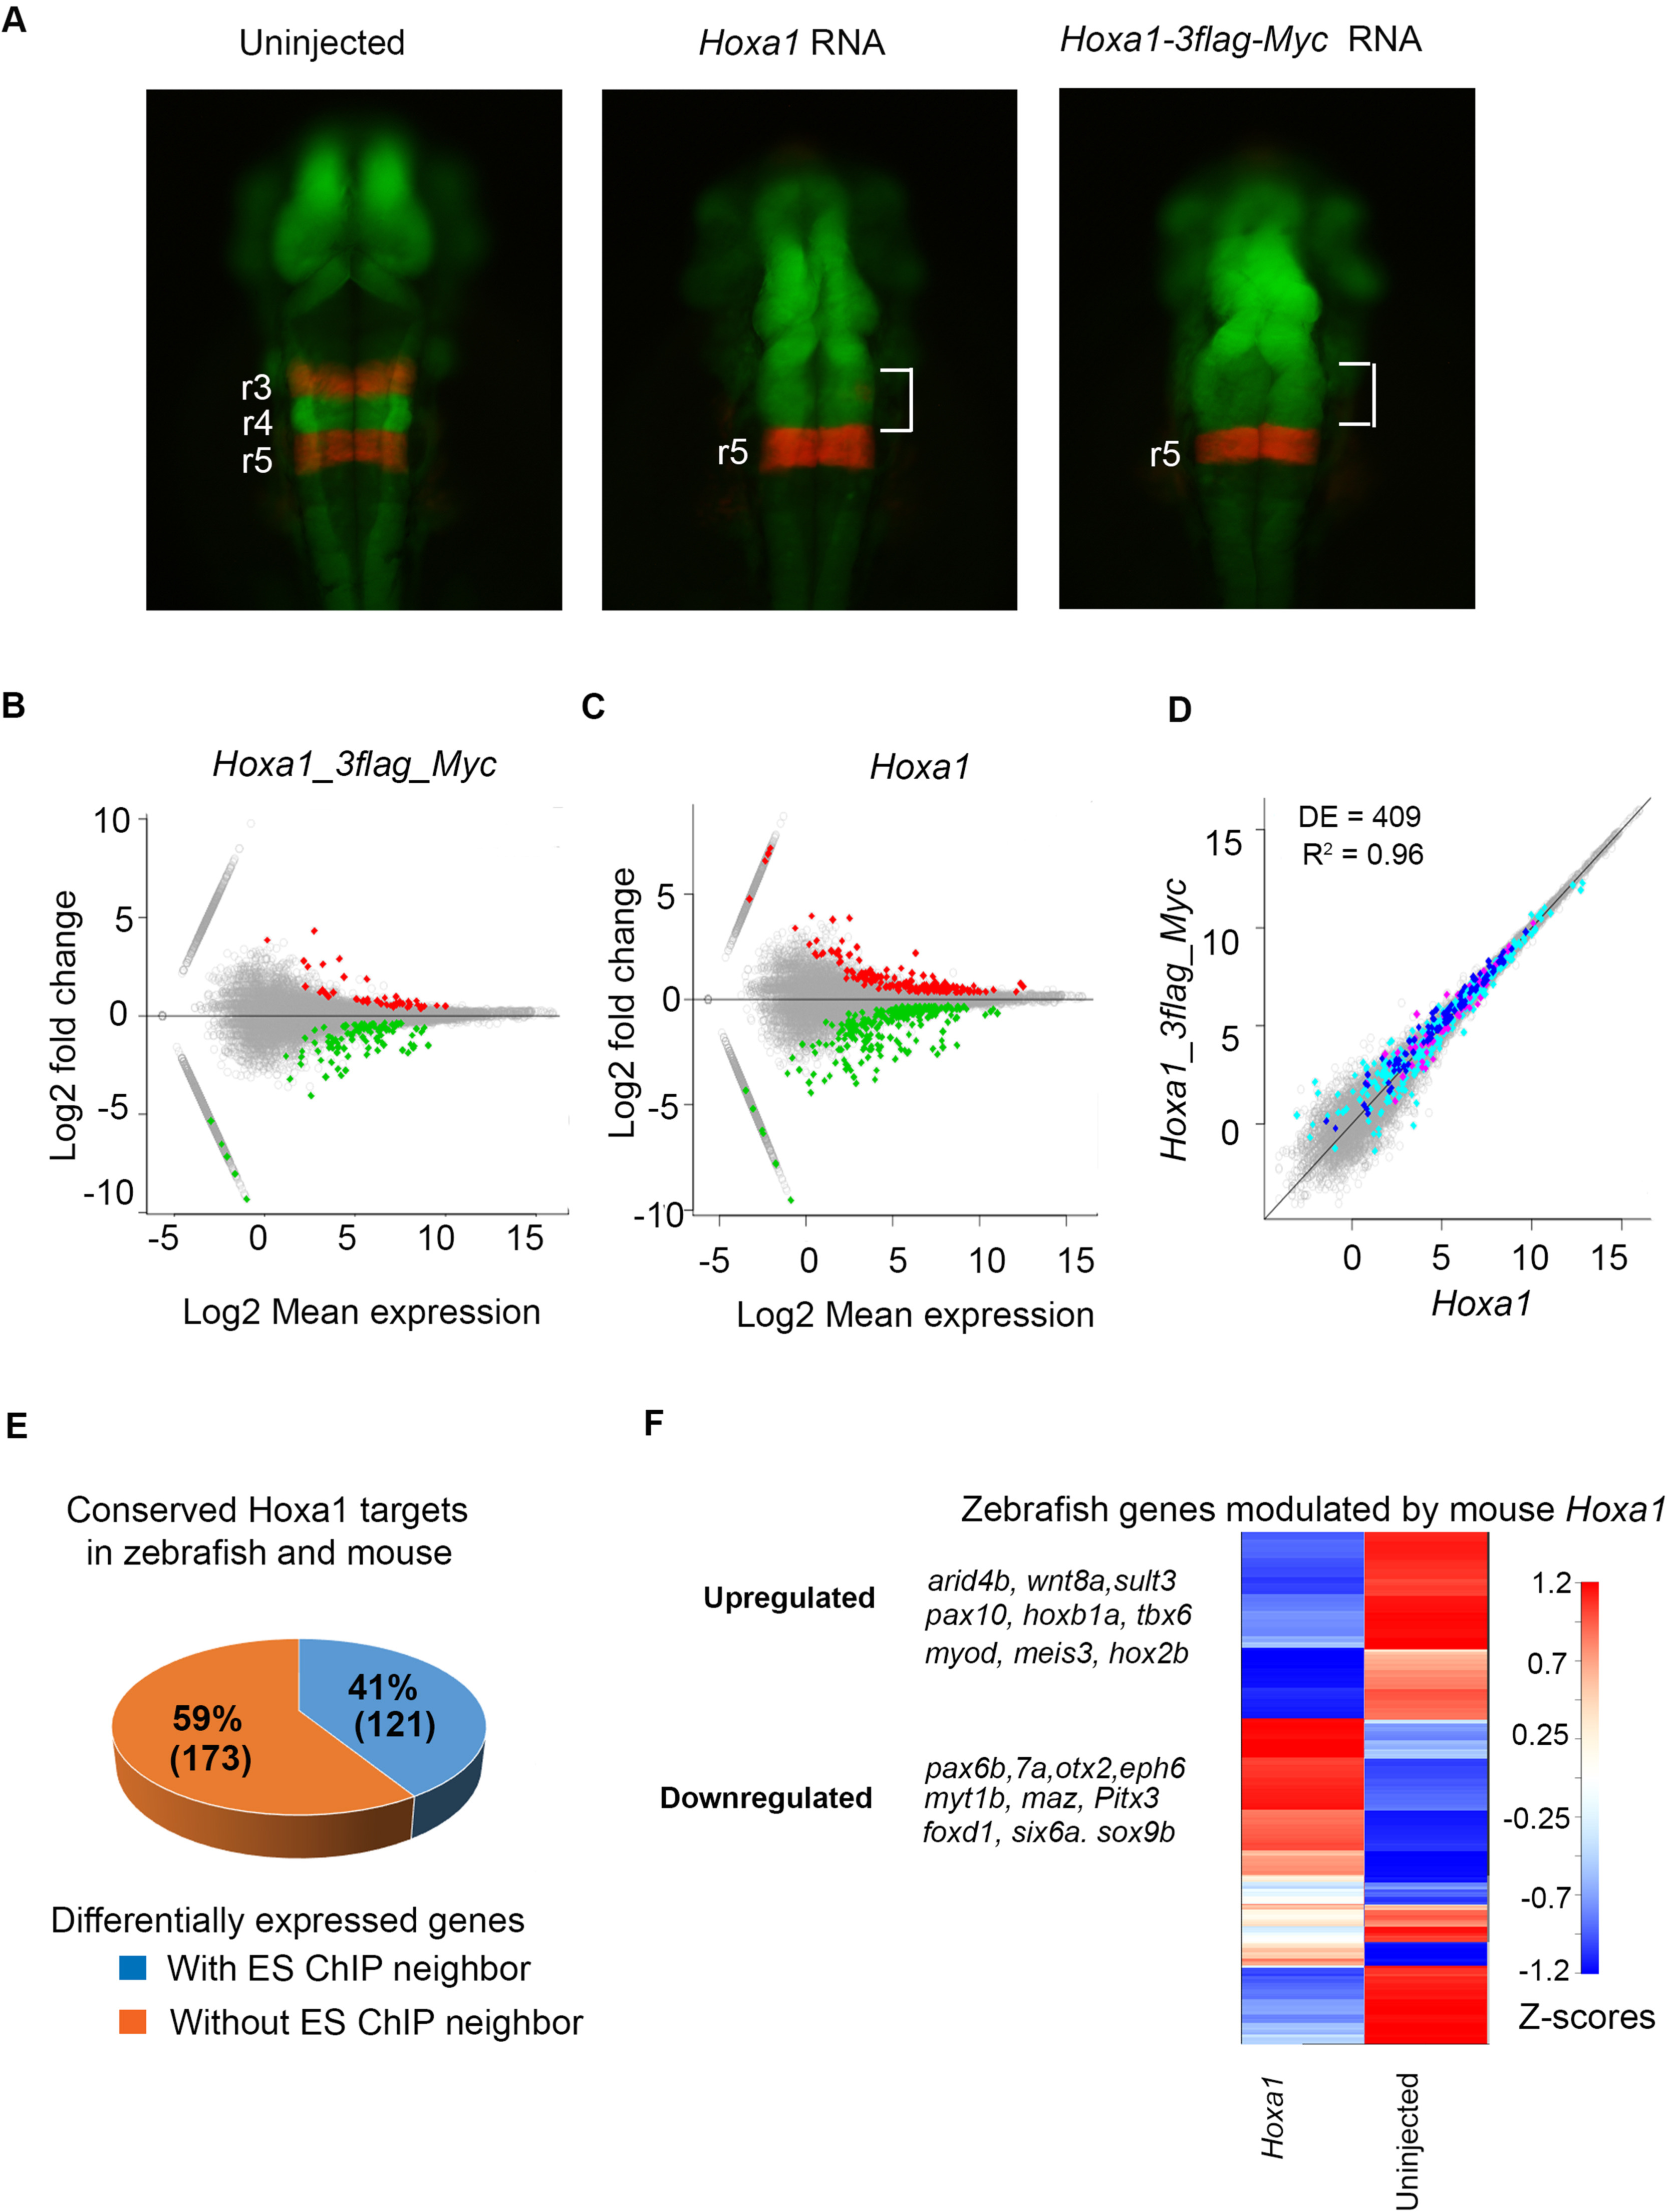
Fig. 7
Evolutionary conservation of Hoxa1 targets. (A) Ectopic expression of Hoxa1 in zebrafish. In control embryos, Red, mCherry reporter expression in rhombomeres 3 and 5 (r3&r5) and green,GFP reporter expression under control of a Hoxb1-ARE enhancer mediates spatially-restricted expression in r4 and the rostral brain. Injection with Hoxa1 or epitope-tagged Hoxa1 RNAs repressed mCherry-specific expression in r3 and anteriorizes r4 expression of GFP (brackets). (B, C) >MA plots showing differentially expressed (DE) genes (as red and green dots) in zebrafish after injection with mouse Hoxa1_3flag_myc (B) or mouse Hoxa1 (C) mRNA. (D) A scatterplot of gene expression values (log2-fold-change) from the two assays show minimal differences (R = 0.96). DE genes are shown in color. (E) Pi chart showing fraction of mouse orthologous genes modulated by Hoxa1 in zebrafish. Nearly half of the orthologous genes have a nearby Hoxa1 binding site, suggesting evolutionary conservation of Hoxa1 targets between mouse and zebrafish. (F) Transcriptional profiling of zebrafish embryos comparing control and mouse Hoxa1 injected embryos (20 hpf). Differential gene expression at FDR ≤ 0.05 are shown as a heatmap with values capped at±3 for visibility. At the left are examples of up and downregulated genes.
Reprinted from Developmental Biology, 432(1), De Kumar, B., Parker, H.J., Paulson, A., Parrish, M.E., Zeitlinger, J., Krumlauf, R., Hoxa1 targets signaling pathways during neural differentiation of ES cells and mouse embryogenesis, 151-164, Copyright (2017) with permission from Elsevier. Full text @ Dev. Biol.