
|
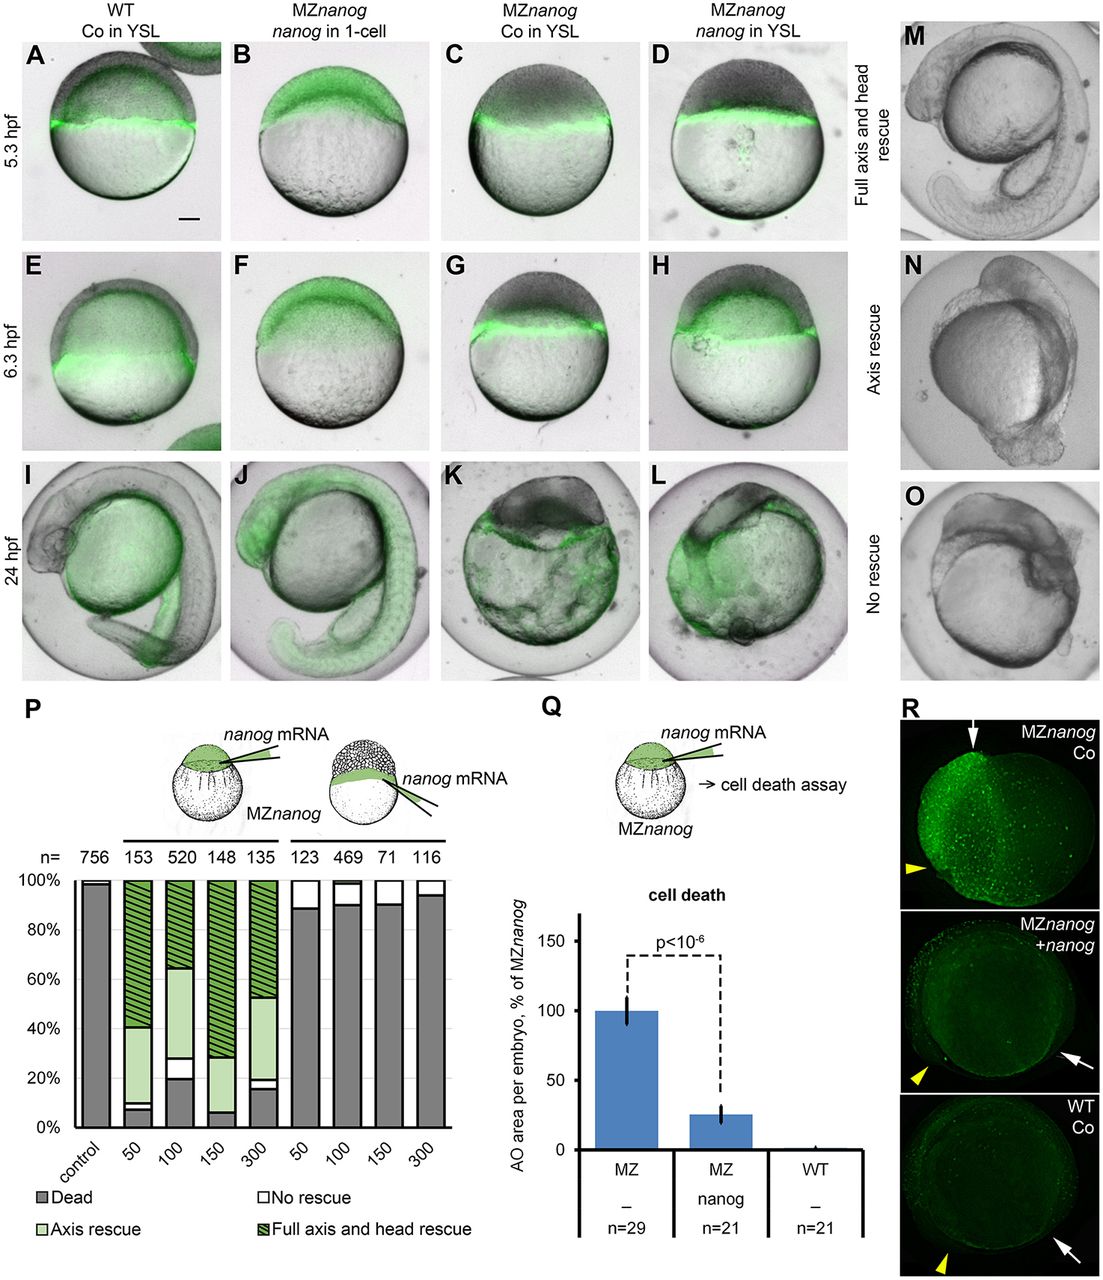
Fig. 5 nanog mRNA injection at 1-cell stage completely rescues MZnanog embryos. (A-L) Representative embryo phenotypes from a single rescue experiment: nanog mRNA or control (Co) mRNA, as indicated, was co-injected with Alexa 488 dextran (green) in the YSL (A,C-E,G-I,K,L) or in 1-cell stage (B,F,J) of wild-type (WT; A,E,I) or MZnanog (B-D,F-H,J-L) embryos. Live images in differential interference contrast and green fluorescence were taken at indicated stages. (M-O) Phenotypic classes used for scoring the rescued phenotypes at 24 hpf. (P) Rescue statistics after 24 hpf. Concentrations of nanog mRNA are indicated below the graph in pg per embryo. Numbers of embryos from two experiments are indicated above the bars. Schematics indicate the injection protocol. (Q,R) nanog mRNA injection at the 1-cell stage rescues cell death of MZnanog. MZnanog embryos were injected with nanog mRNA at 1-cell stage or not injected (–; Co) and stained at 9 hpf with Acridine Orange to detect and score dead cells. (Q) Dead cells rescue statistics: nanog mRNA injection significantly reduces cell death in MZnanog (P<10−6, Student's t-test); n, number of scored embryos. Error bars represent s.e.m. (R) Groups of dead cells in MZnanog control, MZnanog nanog-injected embryos and WT, as indicated. Embryos shown at 12 hpf. Yellow arrowheads and white arrows point to anterior and posterior ends or dorsal embryo axes, respectively. Scale bar: 100 µm (A-O).