
Image
|
Figure Caption
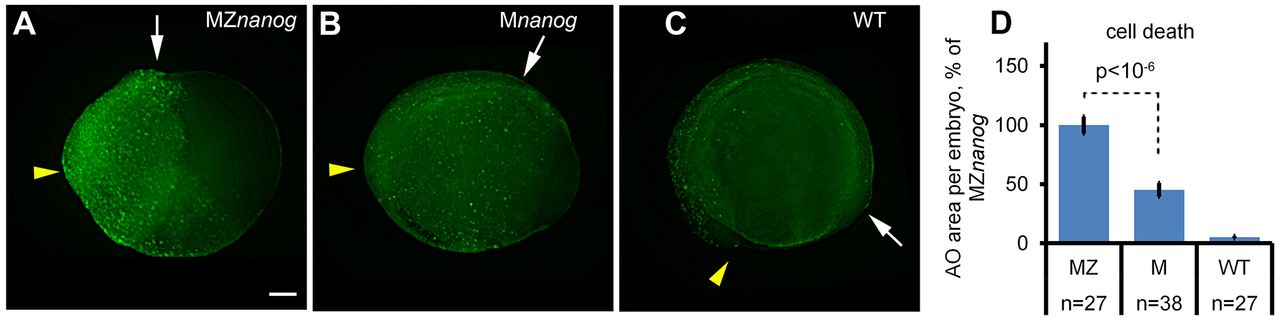
Fig. 2 Cell death is increased in Nanog mutants. (A-C) Groups of Acridine Orange (AO)-stained dead cells in 12 hpf MZnanog (A), Mnanog (B) and wild-type (WT, C) embryos are visible as green spots. Yellow arrowheads and white arrows point to anterior and posterior ends of dorsal embryo axes, respectively. Scale bar: 100 µm. (D) The increase in cell death in MZnanog over Mnanog is statistically significant (P<10−6, Student's t-test); n, number of scored embryos. Error bars represent s.e.m.
Figure Data
Acknowledgments
This image is the copyrighted work of the attributed author or publisher, and
ZFIN has permission only to display this image to its users.
Additional permissions should be obtained from the applicable author or publisher of the image.
Full text @ Development