
|
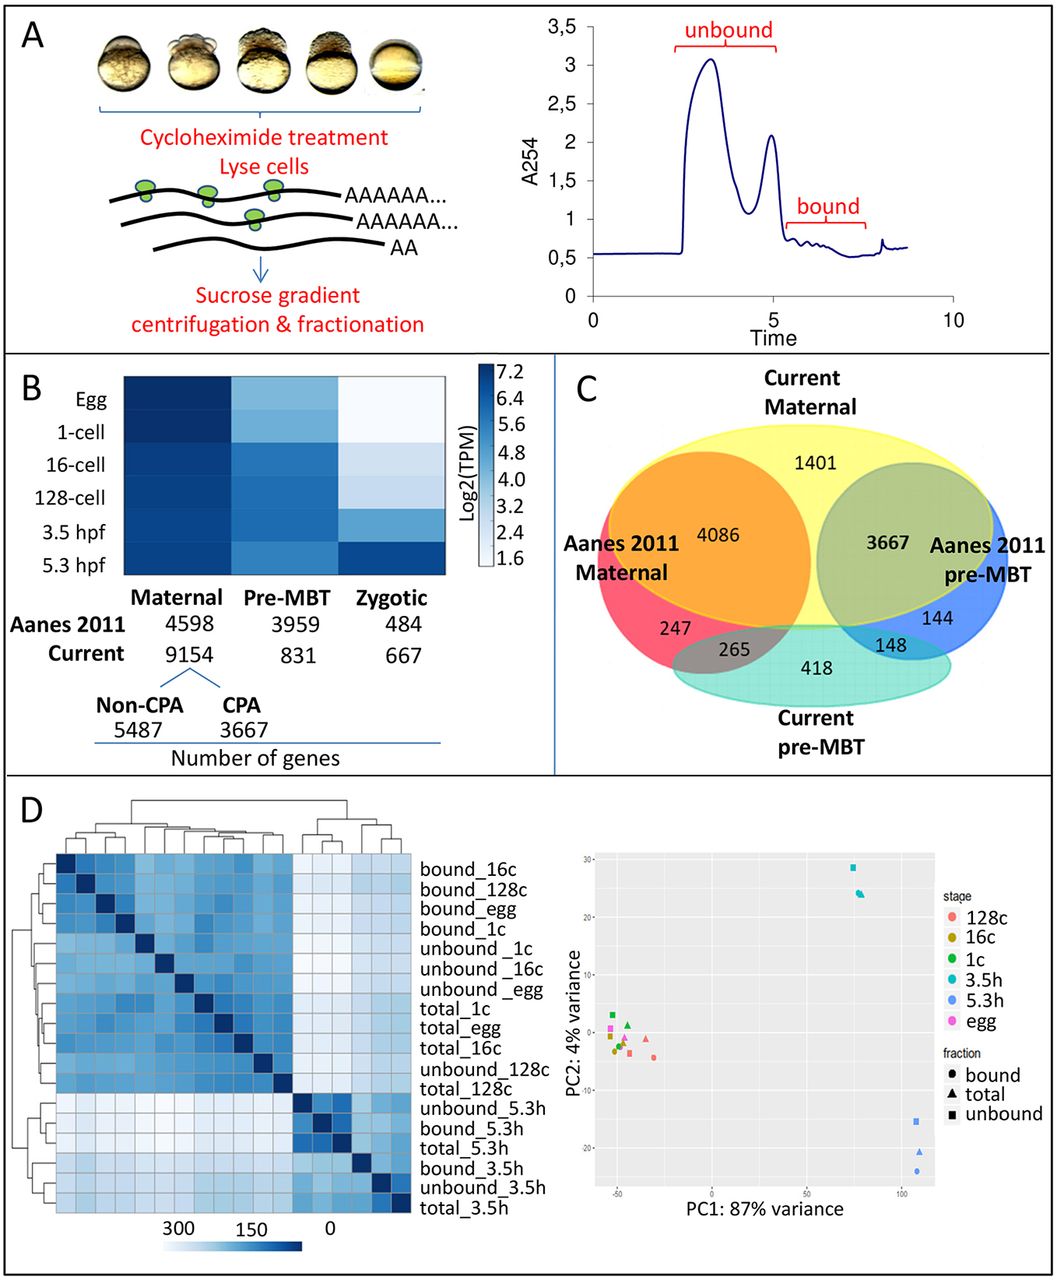
Fig. 1 Polysome profile of the early embryo. (A) Polysome fractionation based on density gradient centrifugation. For each stage, two pooled fractions were obtained that contained polysome-unbound and polysome-bound mRNAs. (B) Gene expression clustering across developmental stages. Genes from Aanes et al. (2011) and the present dataset were clustered into maternal, pre-MBT and zygotic clusters. The maternal cluster was further subdivided based on pre-MBT increase in expression of transcripts that underwent CPA in the Aanes dataset that was attributable to oligo d(T) selection bias. (C) Venn diagram showing overlap between maternal and pre-MBT clusters from both datasets. Notice the large overlap between the Aanes pre-MBT and present maternal cluster. (D) Clustering heat-map and principal component analysis of total and polysome-fractionated samples based on the expression of annotated genes (Ensembl), showing a major division between early and late (MBT and post-MBT) developmental stages. Clustering was performed based on the abundance of transcript level to compute the distances between samples (different color intensity).