
Image
|
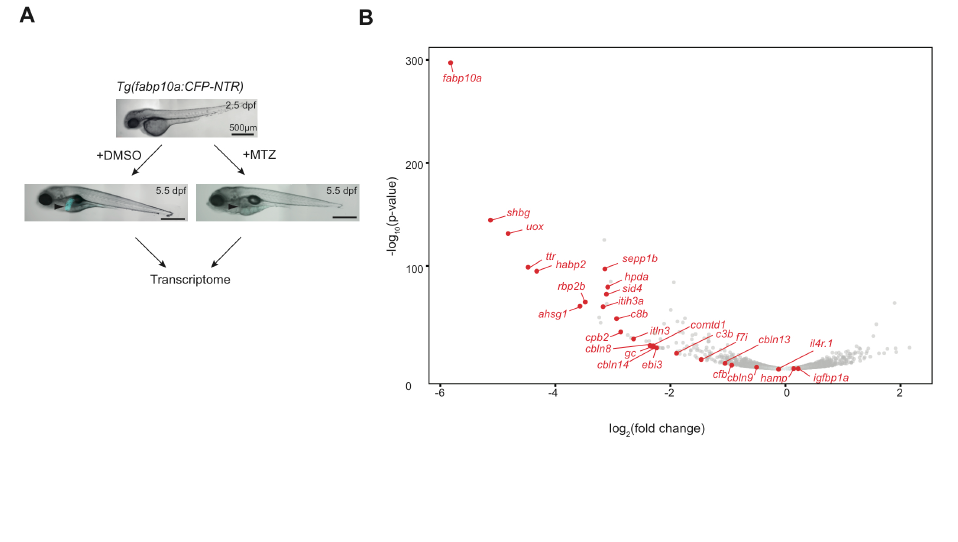
Figure Caption
Fig. s3
Liver genes. A. Generation of “liverless”. Scale bars, 500 μm. Arrowheads denote fluorescent (Cyan) liver. B. Volcano plot of the body-wide transcriptome data of “liverless” showing the liver genes (red). Their expression was significantly reduced in “liverless”, except two genes (igfbp1a and hamp). However, their expression in the liver was confirmed by WISH (Fig. S1A). It is possible that they are upregulated in the small residual liver tissues in “liverless”.
Acknowledgments
This image is the copyrighted work of the attributed author or publisher, and
ZFIN has permission only to display this image to its users.
Additional permissions should be obtained from the applicable author or publisher of the image.
Full text @ Biol. Open