
|
Fig. 6
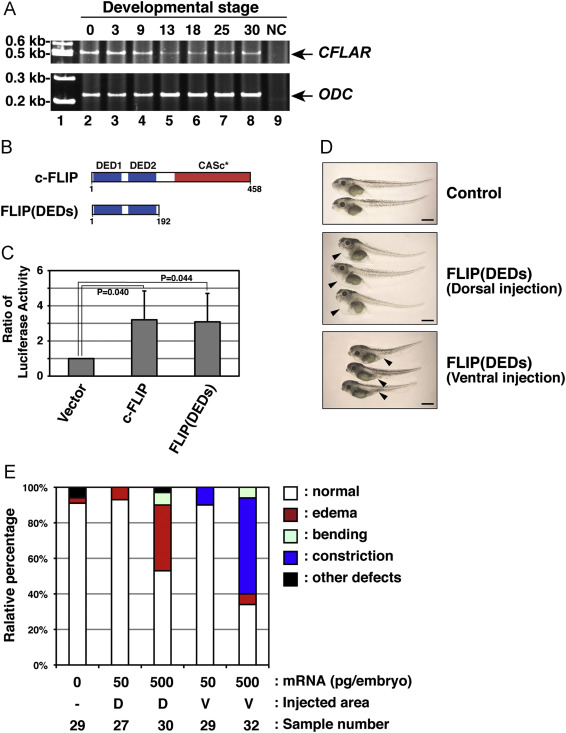
Irregular development of X. laevis embryos expressing a c-FLIP mutant. (A) The expression profile of African clawed frog CFLAR transcripts during embryogenesis. Total RNAs isolated from X. laevis embryos, which were collected at indicated stages (lanes 2–8), was analyzed by RT-PCR. PCR products amplified with primers specific for CFLAR (upper panel) and ODC (lower panel) were resolved by acrylamide-gel electrophoresis. Molecular weight markers were run in lane 1, and a negative control (NC) with no polymerase was run in lane 9. Arrows indicate the expected molecular weights of the CFLAR and ODC PCR products, respectively. (B) The structure of a truncated c-FLIP mutant, FLIP(DEDs), consisting of only two DED motifs. (C) Effect of a FLIP(DEDs) mutant on NF-κB activation. The empty vector or plasmids encoding intact or truncated forms of clawed frog c-FLIP were transiently co-transfected with pNFκB-Luc and pRL-TK into HEK293 cells. After 48 h in cell culture, NF-κB activation was analyzed by measuring enzyme activities of dual luciferases produced in transfected cells using a luminometer. Data are presented as the means and standard deviations of samples counted from three independent experiments. The statistically-significant difference between two groups was evaluated by Student’s t-test. (D) Morphological analysis of embryos expressing FLIP(DEDs). X. laevis embryos were injected without (upper panel) or with mRNA encoding FLIP(DEDs), at the equatorial area of two dorsal (middle panel) or two ventral (lower panel) blastomeres at the four-cell-stage. Images of the developing embryos were acquired at stage 45. Arrowheads indicate the edema and abdominal constriction of the injected embryos, respectively. Scale bars indicate 1 mm. (E) A summary of the phenotypic data presented in (D). Embryos displaying edema (red), abdominal constriction (dark blue), bending (light blue), and other defects (black) were counted under the microscope. Data represent the percentages calculated from five independent experiments. Abbreviations: D, dorsal; V, ventral.