
|
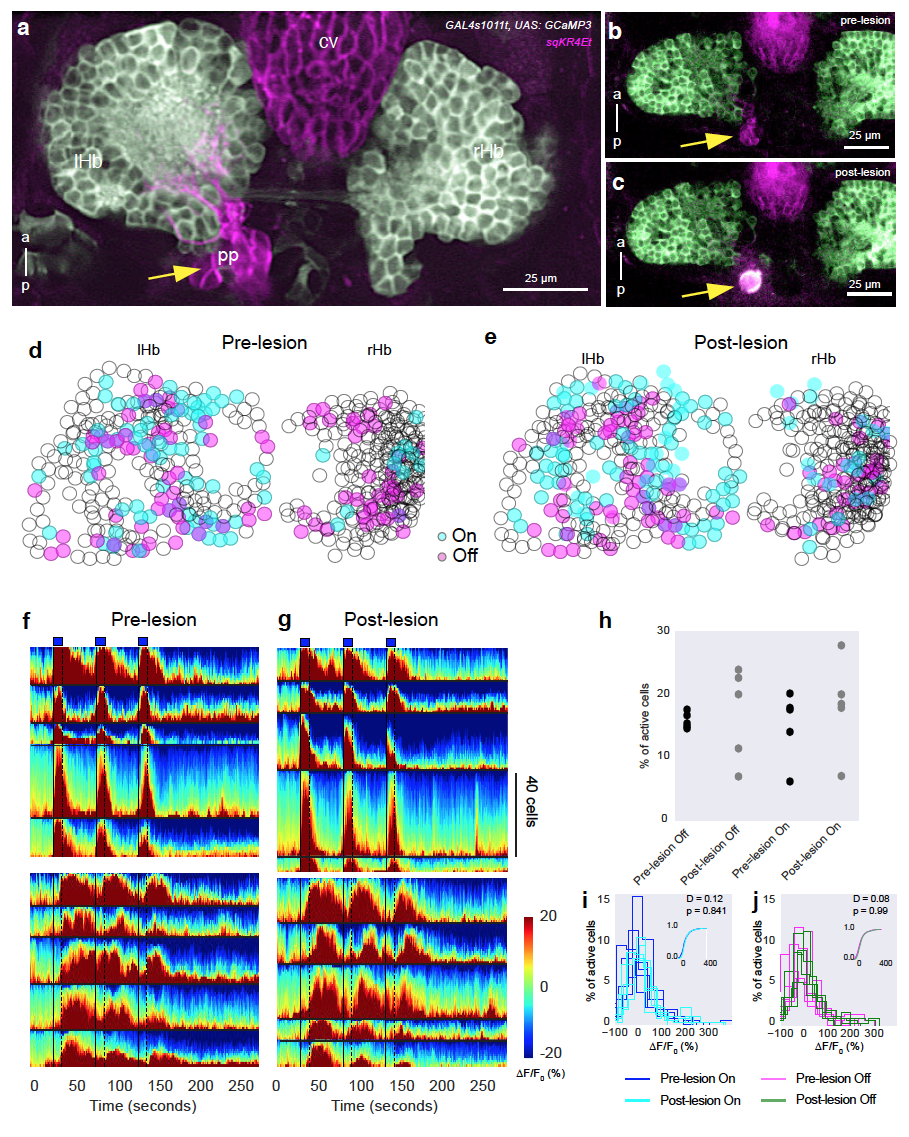
Fig. s7 The effect of the parapineal lesion on habenula response to blue light. a Visualization of the parapineal (yellow arrow), which is located adjacent to the left habenula and innervates the dorsal neuropil. b, c Two-photon lesioning of the parapineal. b Before lesioning. c After lesioning, which led to formation of a bubble (arrow). d, e Habenula cells segmented from five fish, overlaid on top of each other, showing responses before and after the lesion. Cells responding to light ON are shown in blue and to OFF in pink. f, g Heatmaps of the habenula cells, in the five fish, responding to light ON and OFF before (f) and after (g) lesioning the parapineal. Horizontal black lines divide data from different fish. h Percentage of cells showing ON and OFF responses before and after parapineal lesioning. i, j Histogram showing distribution of mean intensity in habenula neurons during light ON (e) and OFF (f) before and after lesion. Insets show cumulative distribution from all fish. P values and test statistic (D) were obtained using the Kolmogorov–Smirnov test. pp parapineal, lHb left habenula, rHb right habenula, cv circumventricular organ, a anterior, p posterior. Scale bar = 25 μm.