
|
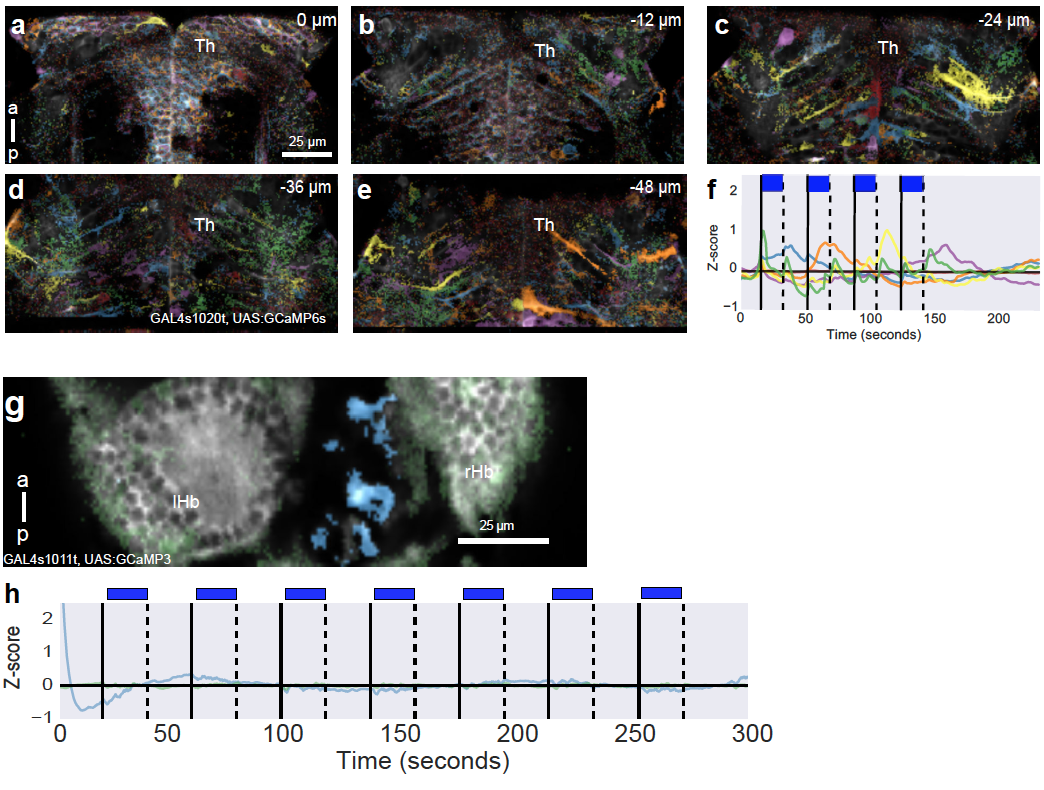
Fig. s8 Examples of signals that were excluded from visualization of K-means clusters. a–e Pixels showing stimulus-independent activity in the thalamus, at five different focal planes. Pixels are colored according to the traces in panel f. For clarity, these signals were excluded from the visualization of clusters representing light-evoked activity shown in Fig. 4a–e. g Stimulus-independent activity in the habenula. Pixels are colored according to the traces in panel h. For clarity, these signals were excluded from the visualization of clusters representing light-evoked activity shown in Fig. 1e–f. f, h Cluster centers that did not represent light-evoked activity in the thalamus and habenula, obtained by running K-means on the time series of pixels in panel a–e and g. Th Thalamus, lHb left habenula, rHb right habenula, a anterior, p posterior.