
|
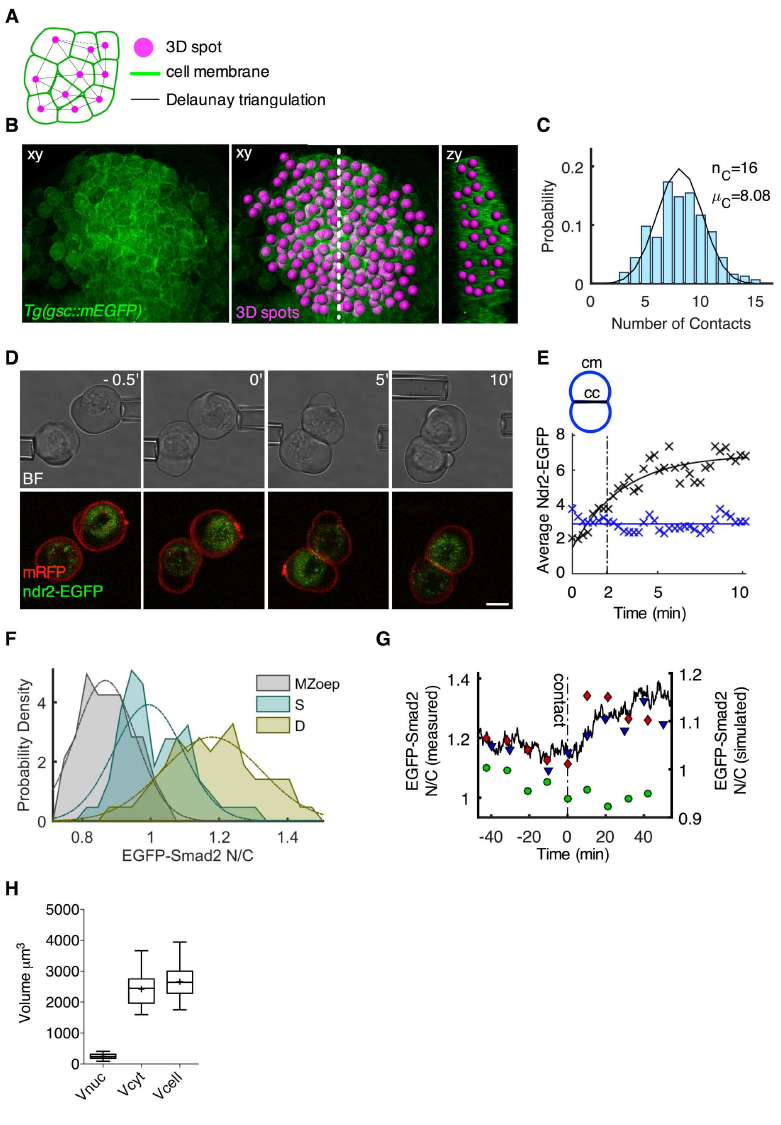
Fig. s4 Experiments to parametrize the mathematical model. Related to Figure 5. (A-C) Quantification of cell-cell contact number within the ppl in vivo. (A) A Delaunay triangulation was computed using 3D coordinates of spots objects and used to infer the number of cell-cell contacts (direct neighbours) of each cell. All edges whose midpoint was closer to another vertex than it was to one of its end vertices were eliminated from the triangulation (dotted edge). (B) Multi-photon images of the ppl of Tg(gsc::mEGFP) embryos at 65% epiboly stage (7 hpf). A 3D spot object was created at the center of each ppl cell, shown in magenta. (C) Probability distribution of ppl cells as a function of their number of cell-cell contacts in vivo. Black curve shows the prediction of our cellular model with a maximum and an average number of contacts of 16 and 8.08, respectively. (D-E) Dynamics of Nodal accumulation at cell-cell contact sites. (D) Bright-field and confocal images of cell-cell contact formation between ppl progenitor cells in culture. Induced ppl progenitor cells were isolated from shield stage (6 hpf) embryos expressing Ndr2-EGFP and membrane-bound RFP (mRFP). Cell-cell contact formation was initiated by gently bringing two cells together using micropipettes, and the newly formed cell doublet was imaged over a period of 10 min at 30 sec intervals. Scale bar, 5 μm (E) Example of Ndr2-EGFP localization in a newly formed ppl cell doublet. Average Ndr2-EGFP intensities at the cell-cell (cc, black crosses) and cell-medium (cm, blue crosses) interfaces were measured independently and plotted as a function of time. The increase in Ndr2-EGFP intensities at the cell-cell interface is best described by an exponential fit (black curve), reaching the half-maximum after 2 min. Ndr2-EGFP intensity remains largely unchanged at the cell-medium interface (blue line). (F) EGFP-Smad2 nuclear-to-cytoplasmic (N/C) ratios of embryonic progenitor cells in culture. Embryonic progenitor cells were isolated via FACS from shield stage (6 hpf) MZoep mutant embryos expressing EGFP-Smad2 and H2A-mCherry. Ppl progenitor cells were isolated via FACS from shield stage (6 hpf) Tg(gsc::tRFP) embryos also expressing EGFP-Smad2 and H2B-BFP. n (MZoep), 14; n (single cells), 22; n (doublets), 21; 3 independent experiments. (G) Changes in EGFP-Smad2 nuclear-to-cytoplasmic ratio upon cell-cell contact formation in three cells. Ppl progenitor cells were isolated via FACS from shield stage (6 hpf) Tg(gsc::tRFP) embryos also expressing EGFP-Smad2 and H2B-BFP, and EGFP-Smad2 nuclear-to-cytoplasmic ratios were measured before and after contact formation. The ratios of the 3 analyzed cell doublets are shown as red diamonds, black triangles and green dots. Note that in 1 (green dots) of the 3 doublets, the EGFP-Smad2 nuclear-to-cytoplasmic ratio did not change upon contact formation. Black dash-dotted line shows time of contact formation, and black curve the Smad2 dynamics of a realization of the stochastic model (see also STAR Methods). Note the different scalings of the y-axis used for the simulated (right y-axis) and measured data (left y-axis) due to higher than average EGFP-Smad2 nuclear-to-cytoplasmic ratios in the measured cells at the beginning of the analysis. (H) Volumes of ppl cells in culture. Ppl progenitor cells were isolated via FACS from shield stage (6 hpf) Tg(gsc::tRFP) embryos expressing also H2B-BFP and nuclear (Vnuc), cytoplasmic (Vcyt) and whole cell (Vcell) volumes were measured after 60 min in culture. Values are shown as Tukey box-and-whiskers plots with median (bar) and average (cross) values. n, 21.
Reprinted from Developmental Cell, 43(2), Barone, V., Lang, M., Krens, S.F.G., Pradhan, S.J., Shamipour, S., Sako, K., Sikora, M., Guet, C.C., Heisenberg, C.P., An Effective Feedback Loop between Cell-Cell Contact Duration and Morphogen Signaling Determines Cell Fate, 198-211.e12, Copyright (2017) with permission from Elsevier. Full text @ Dev. Cell