
|
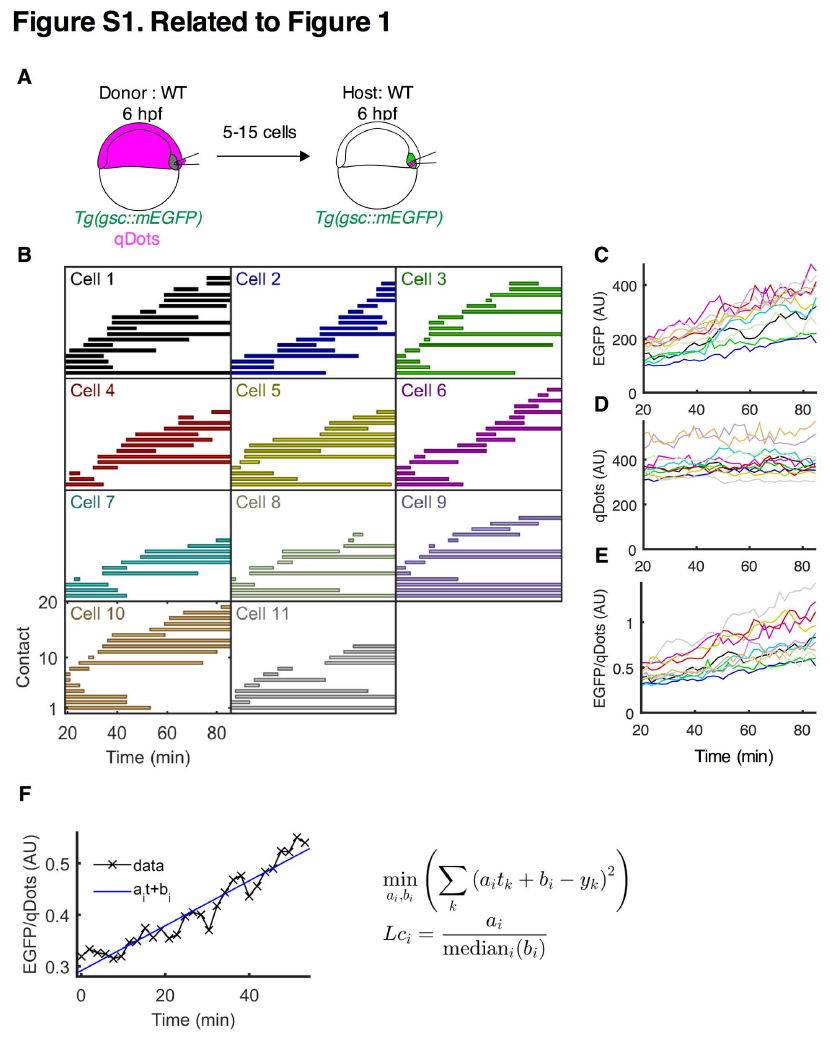
Fig. s1 Prechordal plate progenitor cell-cell contact formation and gsc expression in vivo. Related to Figure 1. (A) Schematic representation of a homotypic/homochronic transplantation assay. (B-E) Representative homotypic/homochronic transplantation experiment. 5-15 ppl cells were transplanted from a Tg(gsc::mEGFP) embryo injected with qDots into a Tg(gsc::mEGFP) non-injected embryo. Transplantation was performed at shield stage (6 hpf) and host embryos were imaged for 60 min between 60% epiboly stage (6.5 hpf) and 70% epiboly stage (7.5 hpf). (B) Cell-cell contact dynamics between transplanted donor and host ppl cells between 60% epiboly stage (6.5 hpf) and 70% epiboly stage (7.5 hpf). Cell-cell contacts formed by each of the transplanted cells (Cell 1-11) were manually tracked over a period of approximately 60 min. Each line within a graph represents one tracked cell-cell contact; n (cells), 11; n (contacts), 167. (C-E) Average fluorescence intensities measured for the 11 transplanted ppl cells as a function of time. Each line represents one cell; color coding matches cell-cell contact duration plots in (B). Transplanted cells were tracked for 60 min and average EGFP (C) and qDots (D) intensities were measured for each cell at 2 min intervals. The ratio between EGFP and qDots average intensities was then calculated for each time point (E) and used to compute the linear coefficient (Lc). Note that this ratio grew approximately linearly with time for all cells during the experimental period. (F) Lc computation of a representative transplanted ppl cell. For each cell, a line was fitted to the evolution of the ratio between EGFP and qDots. The Lc then corresponds to the slope of this line normalized by the median of the intersections with the y-axis over all cells in the same experiment to compensate for varying qDots concentrations between experiments.
Reprinted from Developmental Cell, 43(2), Barone, V., Lang, M., Krens, S.F.G., Pradhan, S.J., Shamipour, S., Sako, K., Sikora, M., Guet, C.C., Heisenberg, C.P., An Effective Feedback Loop between Cell-Cell Contact Duration and Morphogen Signaling Determines Cell Fate, 198-211.e12, Copyright (2017) with permission from Elsevier. Full text @ Dev. Cell