
|
Fig. 6
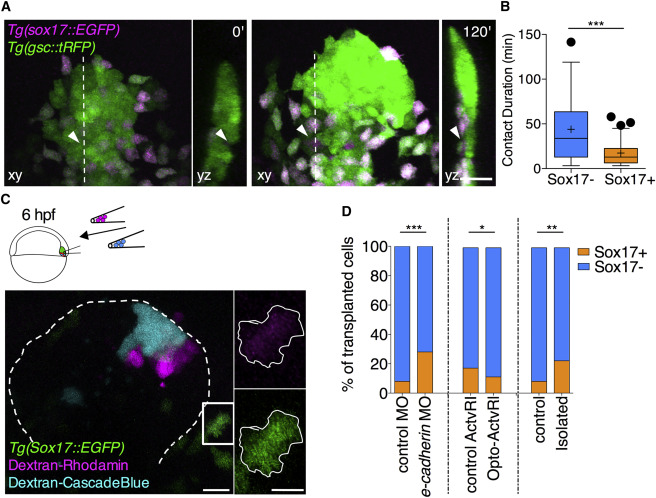
A Positive Feedback Loop between Prechordal Plate Cell-Cell Contact Formation and Nodal Signaling Determines Cell-Fate Specification
(A) Representative images of cells within the ppl of Tg(gsc::tRFP);Tg(sox17::EGFP) embryos at shield (6 hpf, 0 min) and 75% epiboly stages (8 hpf, 120 min). Each image contains a planar x,y view (left) of the ppl and y,z cross-section (right) through the ppl at the level indicated by the dashed white line in the planar view. Arrowheads indicate a tracked ppl cell eventually expressing sox17::EGFP. Scale bar, 50 μm.
(B) Average contact durations for ppl cells either remaining within the ppl or ppl cells that are about to leave the ppl and turn into sox17::EGFP-expressing endoderm cells. Values are shown as Tukey box-and-whisker plots with median (bar) and average (cross) values. n (sox17-), 56; n (sox17+), 85. Statistical test, Mann-Whitney t test, two tailed. ∗∗∗p < 0.001.
(C) Representative confocal image of the ppl of a Tg(sox17::EGFP) host embryo at 90% epiboly stage (9 hpf) containing a mix of transplanted ppl cells from Tg(sox17::EGFP) donor embryos injected with either dextran-Rhodamine or dextran-Cascade blue. Transplantation was performed at shield stage (6 hpf), and images were taken at 90% epiboly stage (9 hpf). Dashed line, ppl outline. Scale bar, 50 μm. Insets, transplanted cell expressing sox17::EGFP with its shape outlined in white. Scale bar, 20 μm.
(D) Relative distribution of sox17::EGFP positive versus negative cells within the population of transplanted ppl cells for three different experimental setups: (1) a mix of control cells expressing control MOs and experimental cells expressing e-cadherin MOs were transplanted. n (control transplanted cells), 305; n (e-cadherin-MO transplanted cells), 323; 3 independent experiments; (2) a mix of control cells expressing a chemically inducible Actvr1 and experimental cells expressing a light-activatable Opto-Actvr1 were transplanted followed by exposition of the transplanted embryos to blue LED light. n (control transplanted cells), 140; n (Opto-Actvr1 transplanted cells), 113; 3 independent experiments; (3) control cells and experimental cells were transplanted with the experimental cells being kept for 20 min in isolation before transplanting them. n (control transplanted cells), 89; n (isolated transplanted cells), 145; 3 independent experiments. Statistical test, resampling, and bootstrap, see STAR MethodsSTAR Methods. ∗p < 0.05; ∗∗p < 0.01; ∗∗∗p < 0.001.
Reprinted from Developmental Cell, 43(2), Barone, V., Lang, M., Krens, S.F.G., Pradhan, S.J., Shamipour, S., Sako, K., Sikora, M., Guet, C.C., Heisenberg, C.P., An Effective Feedback Loop between Cell-Cell Contact Duration and Morphogen Signaling Determines Cell Fate, 198-211.e12, Copyright (2017) with permission from Elsevier. Full text @ Dev. Cell