
|
Fig. 4
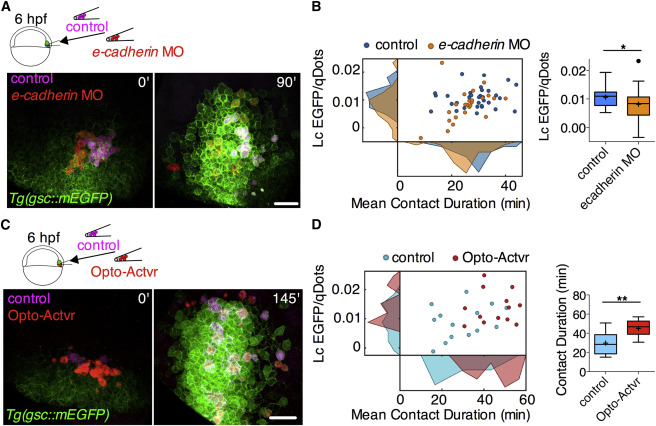
Mutual Enhancement between Prechordal Plate Cell-Cell Contact Formation and Nodal Signaling In Vivo
(A) Representative multi-photon images of ppl cells transplanted from Tg(gsc::mEGFP) embryos injected with either control MOs, qDots, and dextran-Cascade Blue (control cells), or e-cadherin MOs and qDots (e-cadherin morphant cells) into similar staged WT Tg(gsc::mEGFP) embryos. Transplantation was performed at shield stage (6 hpf) and images were taken between 65% epiboly stage (7 hpf) and 75% epiboly stage (8 hpf). Scale bar, 50 μm.
(B) Linear coefficient (Lc) of gsc::mEGFP/qDots increase as a function of mean contact duration for transplanted control and e-cadherin morphant cells between 7 and 8 hpf. Frequency distributions of linear coefficients and mean contact durations are shown on the respective axes. Lc values are also shown as Tukey box-and-whisker plots. n (control cells), 33; n (e-cadherin morphant cells) 24; 2 independent experiments. Statistical test, Student t test, two tailed. ∗p < 0.05.
(C) Representative multi-photon images of ppl cells transplanted from Tg(gsc::mEGFP) embryos injected with either mRNA encoding for a chemically activated form of Actvr1, qDots, and dextran-Cascade blue (control cells) or mRNA encoding for a light-activated form of Actvr1 and qDots (Opto-Actvr1 cells) into similar staged WT Tg(gsc::mEGFP) embryos. Transplantation was performed at shield stage (6 hpf), and images were taken between 75% epiboly stage (8 hpf) and 90% epiboly stage (9 hpf). Scale bar, 50 μm. See also Figure S3.
(D) Linear coefficient (Lc) of gsc::mEGFP/qDots increase as a function of mean contact duration for transplanted control and Opto-Actvr1-expressing cells between 8 and 9 hpf. Frequency distributions of linear coefficients and mean contact durations are shown on the respective axes. Mean contact durations are also shown as Tukey box-and-whisker plots. n (control cells), 14; n (Opto-Actvr1 cells), 13; 2 independent experiments. Statistical test, Student t test, two tailed. ∗∗p < 0.01. Note that the absolute values of Lc may differ from Figures 1Figures 1E and 1F as a later temporal window has been analyzed in these experimental sets.
Reprinted from Developmental Cell, 43(2), Barone, V., Lang, M., Krens, S.F.G., Pradhan, S.J., Shamipour, S., Sako, K., Sikora, M., Guet, C.C., Heisenberg, C.P., An Effective Feedback Loop between Cell-Cell Contact Duration and Morphogen Signaling Determines Cell Fate, 198-211.e12, Copyright (2017) with permission from Elsevier. Full text @ Dev. Cell