
Fig. s5
- ID
- ZDB-IMAGE-180323-21
- Publication
- Herbert et al., 2017 - Dynein/dynactin is necessary for anterograde transport of Mbp mRNA in oligodendrocytes and for myelination in vivo.
- All Figures
- Figures for Herbert et al., 2017
|
Fig. s5
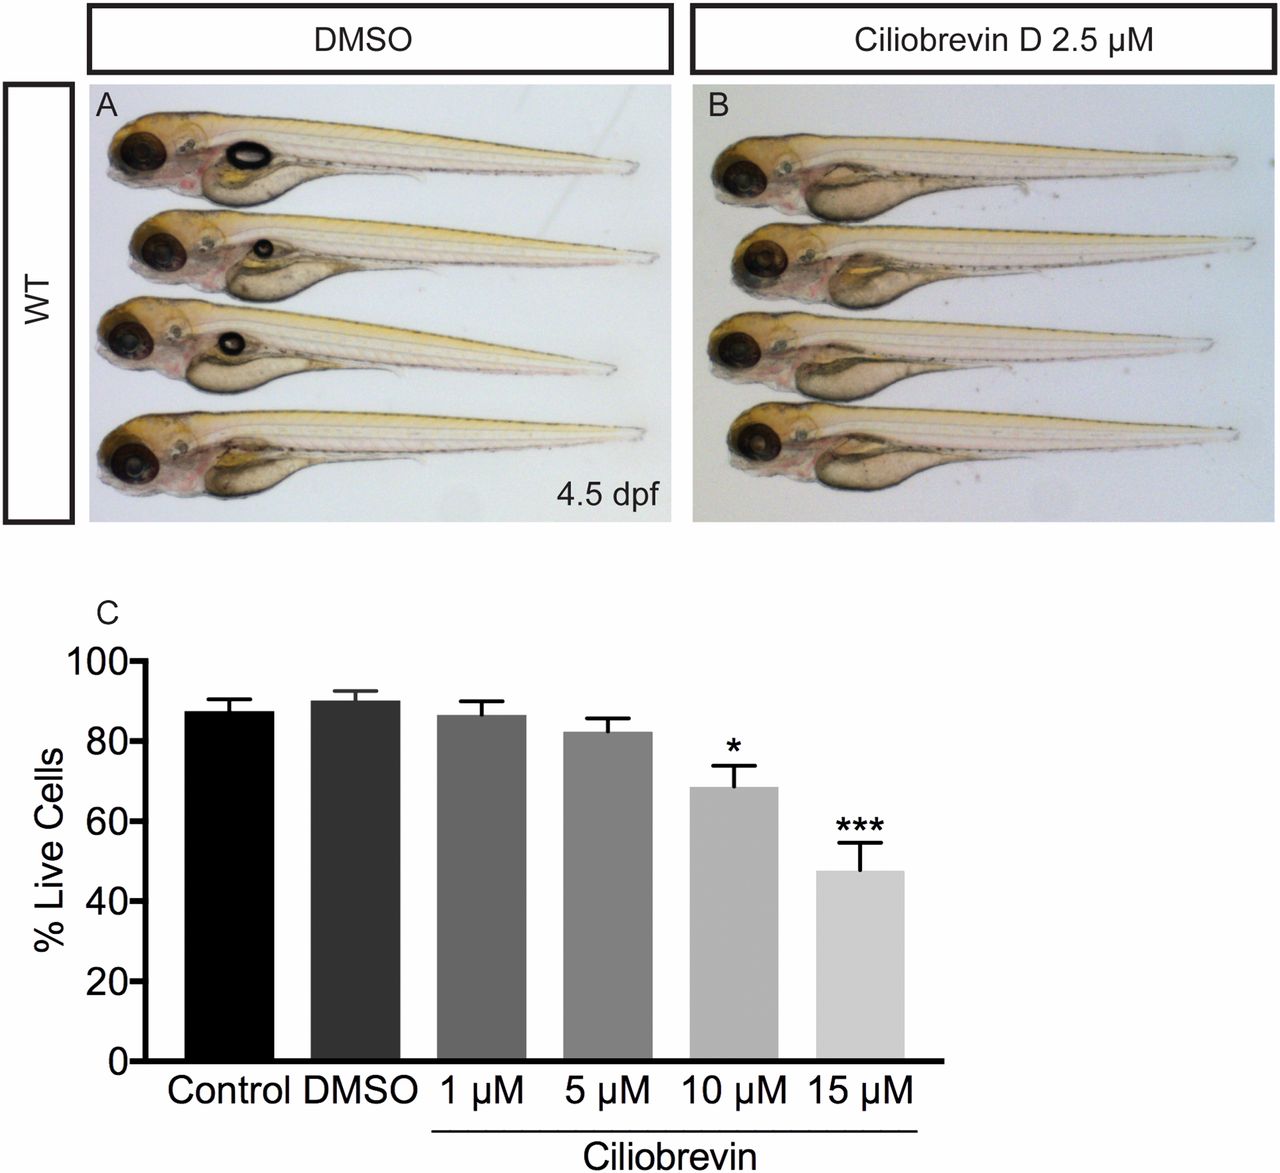
Effects of ciliobrevin D treatment on zebrafish and cultured oligodendrocytes (related to Fig. 7). (A and B) DMSO and ciliobrevin D-treated fish at 4.5 dpf. Compared with fish treated with DMSO for 21 h (A), ciliobrevin D-treated fish look relatively normal. (Magnification: A and B, 16×.) (C) Treatment of oligodendrocytes differentiated for 3 d in vitro with different concentrations of the dynein inhibitor ciliobrevin for 21 h. Cell death was assayed by morphology using DIC microscopy; living cells contained continuous, nonbulbous branches and adhered to coverslips. Concentrations of 1 μM and 5 μM did not significantly alter the percentage of living cells, while 10 μM and 15 μM significantly decreased the percentage of living cells (n = 4 coverslips per group; *P = 0.023, ***P = 0.0001, one-way ANOVA).