
|
Fig. 2
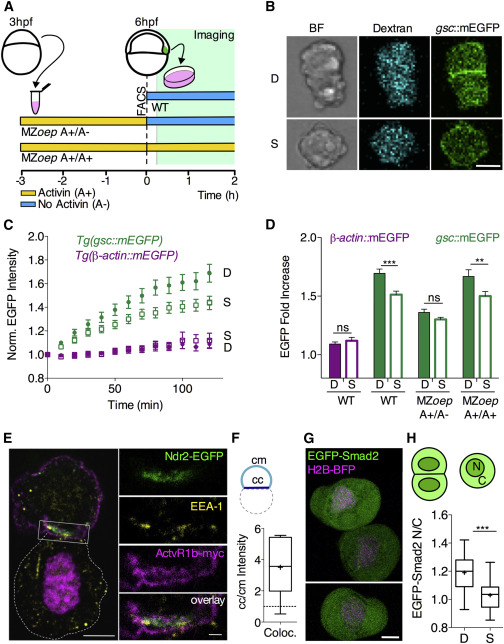
Prechordal Plate Cell-Cell Contact Formation Promotes Nodal Signaling In Vitro
(A) Schematic representation of the experimental design. Gsc::mEGFP positive cells were isolated via FACS from WT Tg(gsc::mEGFP) embryos injected with fluorescent dextran-Alexa648 at shield stage (6 hpf) and seeded on non-adhesive substrates for subsequent imaging. MZoep;Tg(gsc::mEGFP) embryos injected with dextran-Alexa648 were dissociated at 3 hpf, and cells were exposed to Activin for 3 hr in culture. Activin-induced Gsc::mEGFP positive cells were then selected by FACS and seeded on non-adhesive substrates for subsequent imaging. During imaging, selected cells were kept in culture medium either containing Activin (MZoep A+/A+) or not (MZoep A+/A-).
(B) Representative images of doublets (D) and single cells (S) obtained from WT Tg(gsc::mEGFP) at shield stage (6 hpf) after 160 min in culture. Scale bar, 10 μm.
(C) Fold increase of average gsc::mEGFP intensities in single cells (S) versus cell doublets (D) as a function of time in culture for ppl cells isolated from Tg(gsc::mEGFP) or Tg(gsc::tRFP);Tg(β-actin::mEGFP) at shield stage (6 hpf). Plotted values, mean ± 95% CI. n (gsc::mEGFP, single cells), 41; n (gsc::mEGFP, doublets), 40; 5 independent experiments. n (β-actin::mEGFP, single cells), 18; n (β-actin::mEGFP, doublets), 19; 5 independent experiments.
(D) Average gsc::mEGFP fold increase for doublets (D) and single (S) ppl cells taken from WT or MZoep;Tg(gsc::mEGFP) embryos at shield stage (6 hpf) and cultured for 120 min in the presence (A+/A+) or absence (A+/A–) of Activin within the culture medium. Plotted values, mean ± SEM. n (β-actin::mEGFP, single cells), 18; n (β-actin::mEGFP, doublets), 19; 5 independent experiments. n (gsc::mEGFP, single cells), 52; n (gsc::mEGFP, doublets), 42; 5 independent experiments. n (MZoep, gsc::mEGFP, (A+/A−), single cells), 52; n (MZoep, gsc::mEGFP, (A+/A−), doublets), 47; n (MZoep, gsc::mEGFP, (A+/A+), single cells), 36; n (MZoep, gsc::mEGFP, (A+/A+), doublets), 36; 7 independent experiments. Statistical test, two-way ANOVA and Bonferroni post test; ∗∗p < 0.005; ∗∗∗p < 0.001; ns, not significant.
(E) Confocal image of a ppl cell doublet isolated from embryos overexpressing Ndr2EGFP and ActvR1b-myc at 6 hpf and kept in culture for 60 min, showing the subcellular localization of Ndr2-EGFP relative to ActvR1b-myc and EEA1 visualized by immunohistochemistry in the top cell. The bottom cell (outlined by white dashed line) only expresses H2A-Cherry to mark its nucleus. Scale bar, 5 μm. Inset shows high magnification of the colocalization between EEA1, Ndr2-EGFP, and ActvR1b-myc at the cell-cell contact. Scale bar, 1 μm.
(F) Intensity ratios of colocalizing EEA1, Ndr2-EGFP, and Actvr1b-myc at cell-cell (cc) versus cell-medium (cm) interfaces of ppl cell doublets obtained from embryos at 6 hpf and kept in culture for 60 min. Values are shown as Tukey box-and-whisker plots with median (bar) and average values (cross). n (doublets), 6; 2 independent experiments.
(G) Representative images of ppl cells isolated from Tg(gsc::tRFP) embryos at shield stage (6 hpf) expressing EGFP-Smad2 and H2B-BFP after 60 min in culture. Scale bar, 5 μm.
(H) EGFP-Smad2 nuclear-to-cytoplasmic (N/C) ratios for ppl cell doublets (D) and single cells (S) taken from WT Tg(gsc::tRFP) embryos expressing EGFP-Smad2 and H2B-BFP after 60 min in culture. Values are shown as Tukey box-and-whisker plots with median (bar) and average values (cross). n (single cells), 27; n (doublets), 22; 3 independent experiments. Statistical test, Student t test, two tailed; ∗∗∗p < 0.001. See also Figure S2 and Movie S2.
Reprinted from Developmental Cell, 43(2), Barone, V., Lang, M., Krens, S.F.G., Pradhan, S.J., Shamipour, S., Sako, K., Sikora, M., Guet, C.C., Heisenberg, C.P., An Effective Feedback Loop between Cell-Cell Contact Duration and Morphogen Signaling Determines Cell Fate, 198-211.e12, Copyright (2017) with permission from Elsevier. Full text @ Dev. Cell