
|
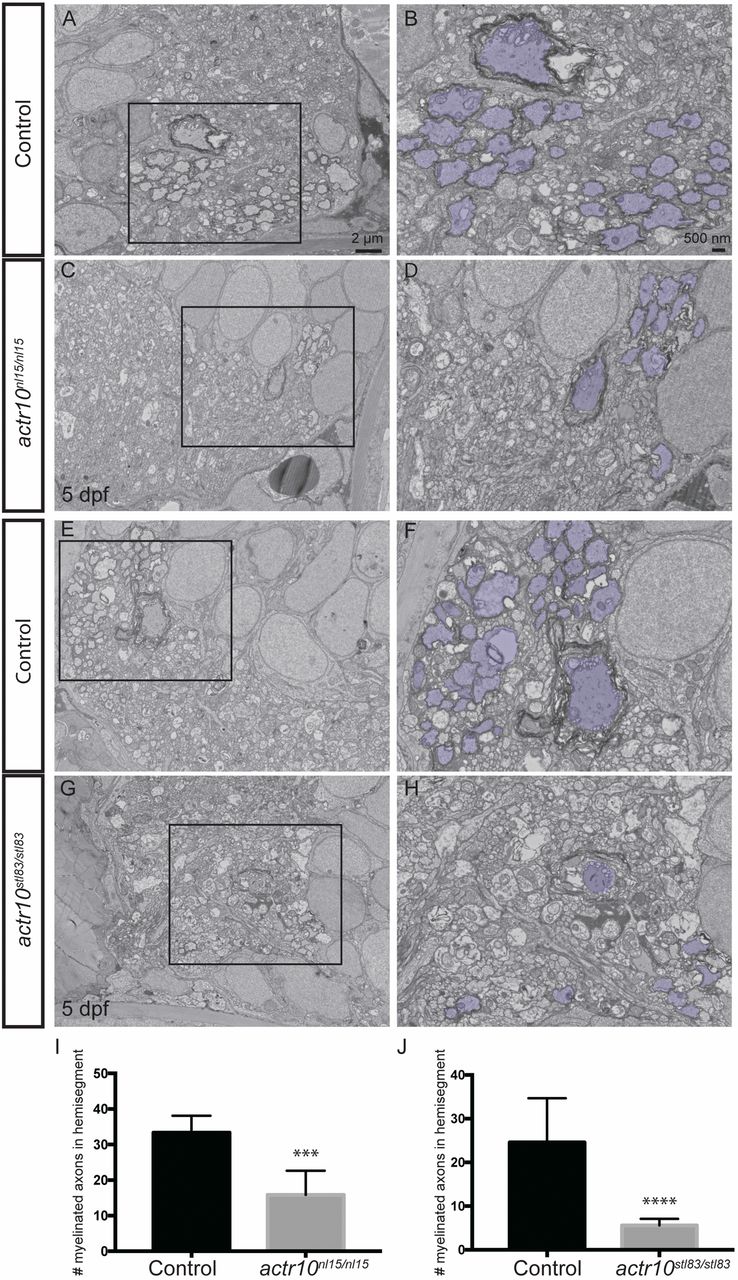
Fig. 2
actr10 mutants have fewer myelinated axons in the ventral spinal cord. (A) Myelinated axons in a control larva in a hemisegment of the ventral spinal cord at 5 dpf. (B) Pseudocoloring and higher magnification enhance visualization of control myelinated axons. (C and D) Myelinated axons are similarly shown in a quadrant of the ventral spinal cord in an actr10nl15/nl15 mutant animal. (E and F) Myelinated axons in a control larva in a quadrant of the ventral spinal cord at 5 dpf. (G and H) Myelinated axons are similarly shown in a quadrant of the ventral spinal cord in an actr10stl83/stl83 mutant animal at 5 dpf. (I and J) Quantification revealed a significant difference in the number of myelinated axons in a ventral quadrant between control animals (n = 6) and actr10nl15/nl15 mutants (n = 4; ***P < 0.0006) (I) and between control animals (n = 8) and actr10stl83/stl83 mutants (n = 5; ****P < 0.0001) (J) at 5 dpf. Unpaired t tests with Welch’s correction were used for statistical analysis.