
|
Fig. 1
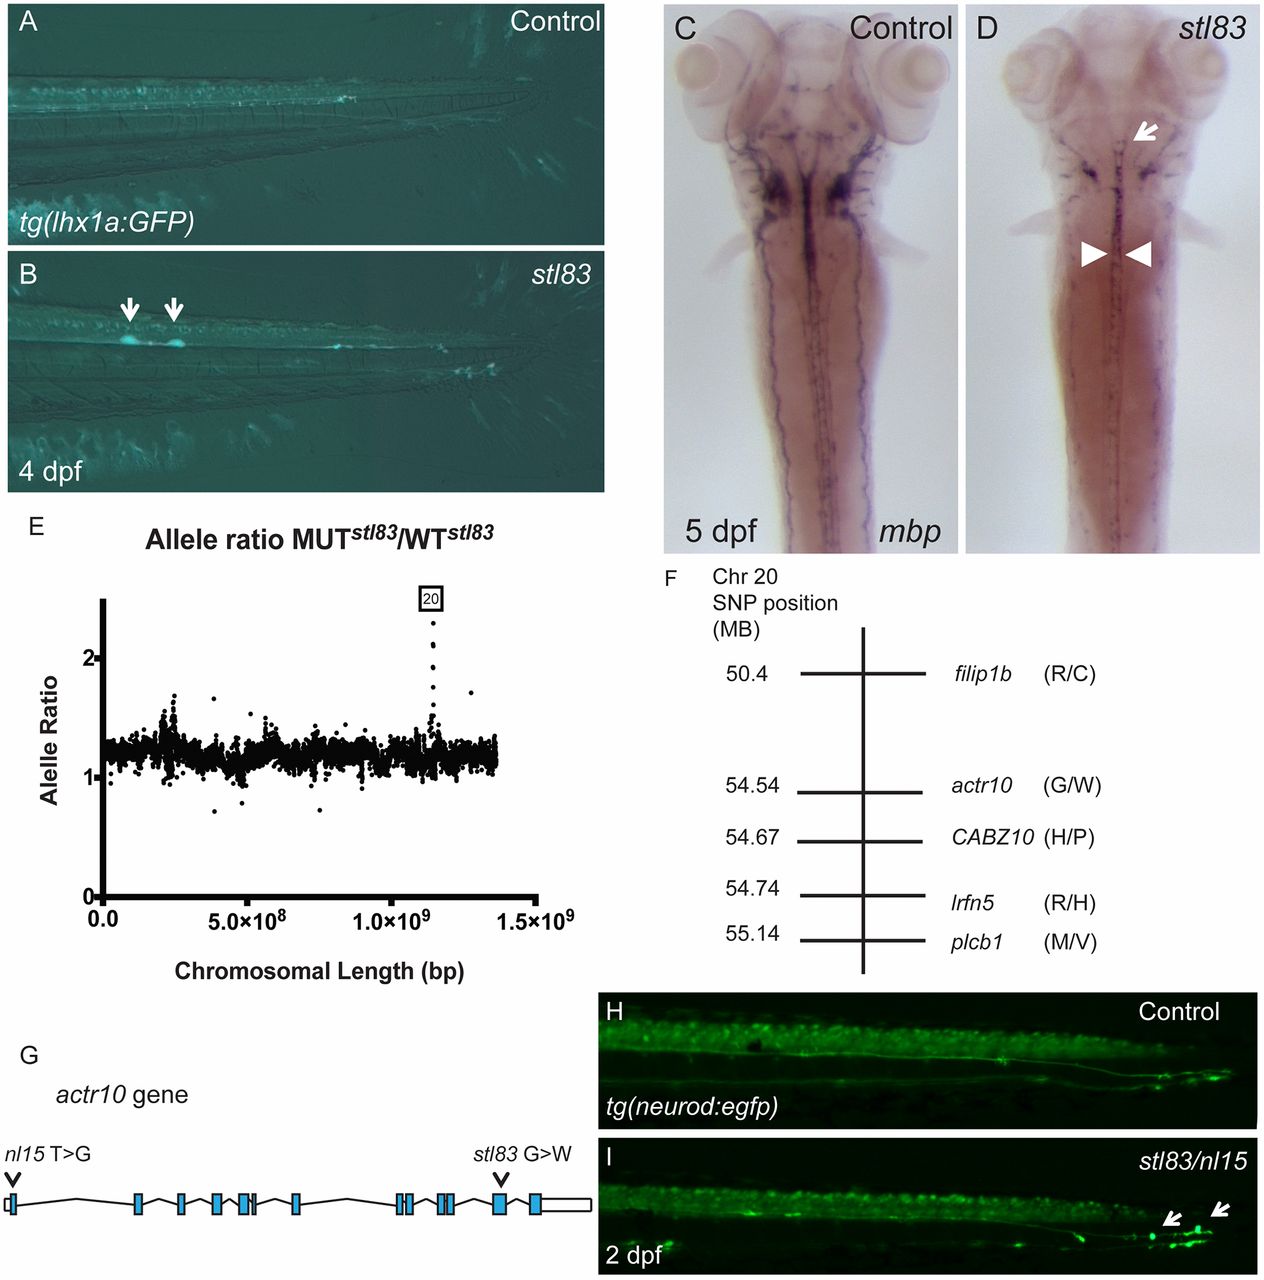
A forward genetic screen uncovers actr10 mutants. (A) tg(lhx1a:gfp) marks axons in the tail of a control zebrafish larva at 4 dpf. (B) stl83 mutants exhibit axonal swellings in the CNS (arrows). (C) mbp ISH in a control animal at 5 dpf shows robust mbp mRNA levels. (D) An stl83 mutant animal exhibits reduced mbp mRNA in the hindbrain (arrow) and spinal cord (arrowheads). (E) Analysis of whole genome sequencing data revealed a higher mutant-to-WT allele ratio on chromosome 20, and SNP subtraction analysis (F) narrowed the number of candidate genes to five. (G) Diagram of actr10 genomic structure shows the location of the nl15 mutation in exon 1 and the stl83 mutation in exon 12. (H) In a tg(neurod:egfp) background, the lateral line is normal in the tail of control animals at 2 dpf. (I) A complementation cross demonstrated that transheterozygous stl83/nl15 animals have axonal swellings in the PNS (actr10stl83/nl15: n = 22) (arrows), which are never seen in either heterozygous or WT animals from either genotype (actr10+/+: n = 47; actr10stl83/+: n = 13; actr10nl15/+: n = 9). A, B, H, and I, lateral views, dorsal up; C and D, dorsal views, anterior up. (Magnification: A and B, 80×; C and D, 50×; H and I, 160×.)