
|
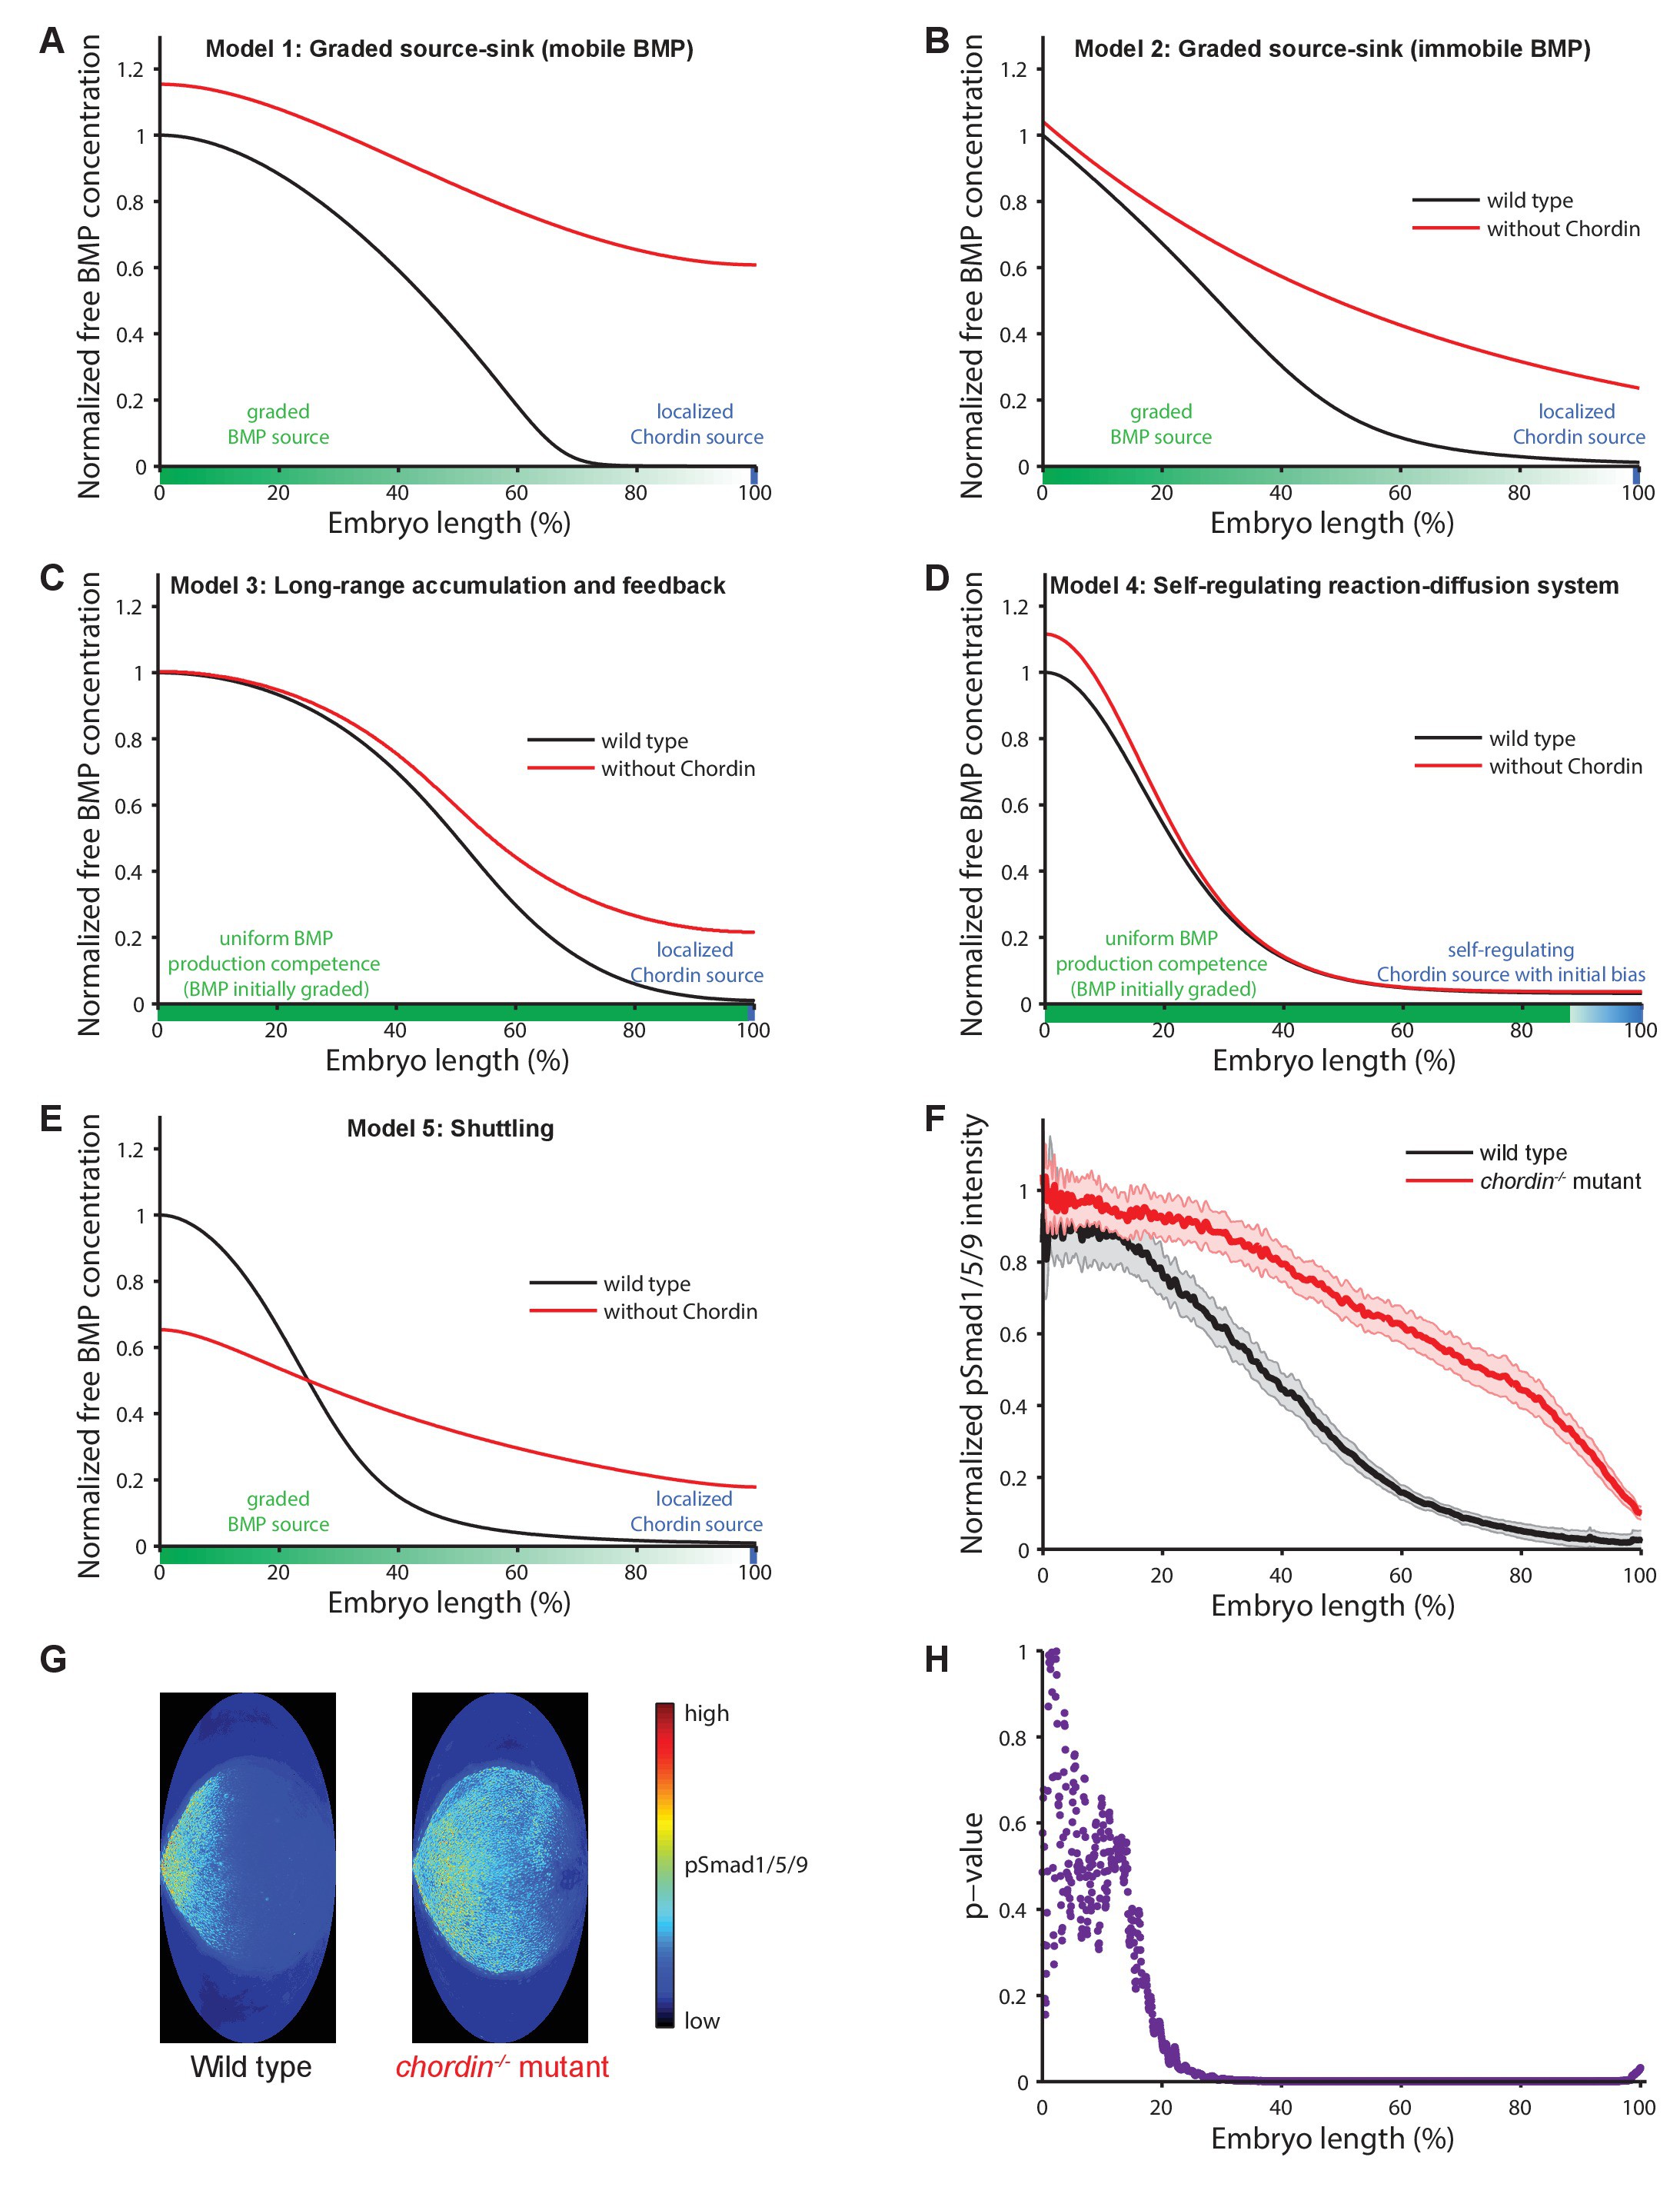
Fig. 2 Theoretical predictions for the influence of the inhibitor Chordin on the BMP signaling gradient and experimental test.
(A–E) Simulations of BMP distributions in five major models of dorsal-ventral patterning in the presence (black) or absence (red) of Chordin. The BMP and Chordin sources are indicated below each graph in green and blue, respectively. Note that the spatial production rates in Models 3 and 4 are modulated over time by feedback. (F–G) Quantification of average pSmad1/5/9 distributions in wild type (black) and chordin−/− (red) embryos using one-dimensional projections of 2D maps. Wild type n = 7, chordin−/− mutants n = 10. Error bars denote standard error. (H) p-values (unpaired two-tailed t-test assuming equal variance) calculated as a function of space between pSmad1/5/9 distributions in wild type and chordin−/− embryos shown in (F) indicate no significant difference of pSmad1/5/9 on the ventral side but a dramatic expansion into dorsal-lateral domains.