
|
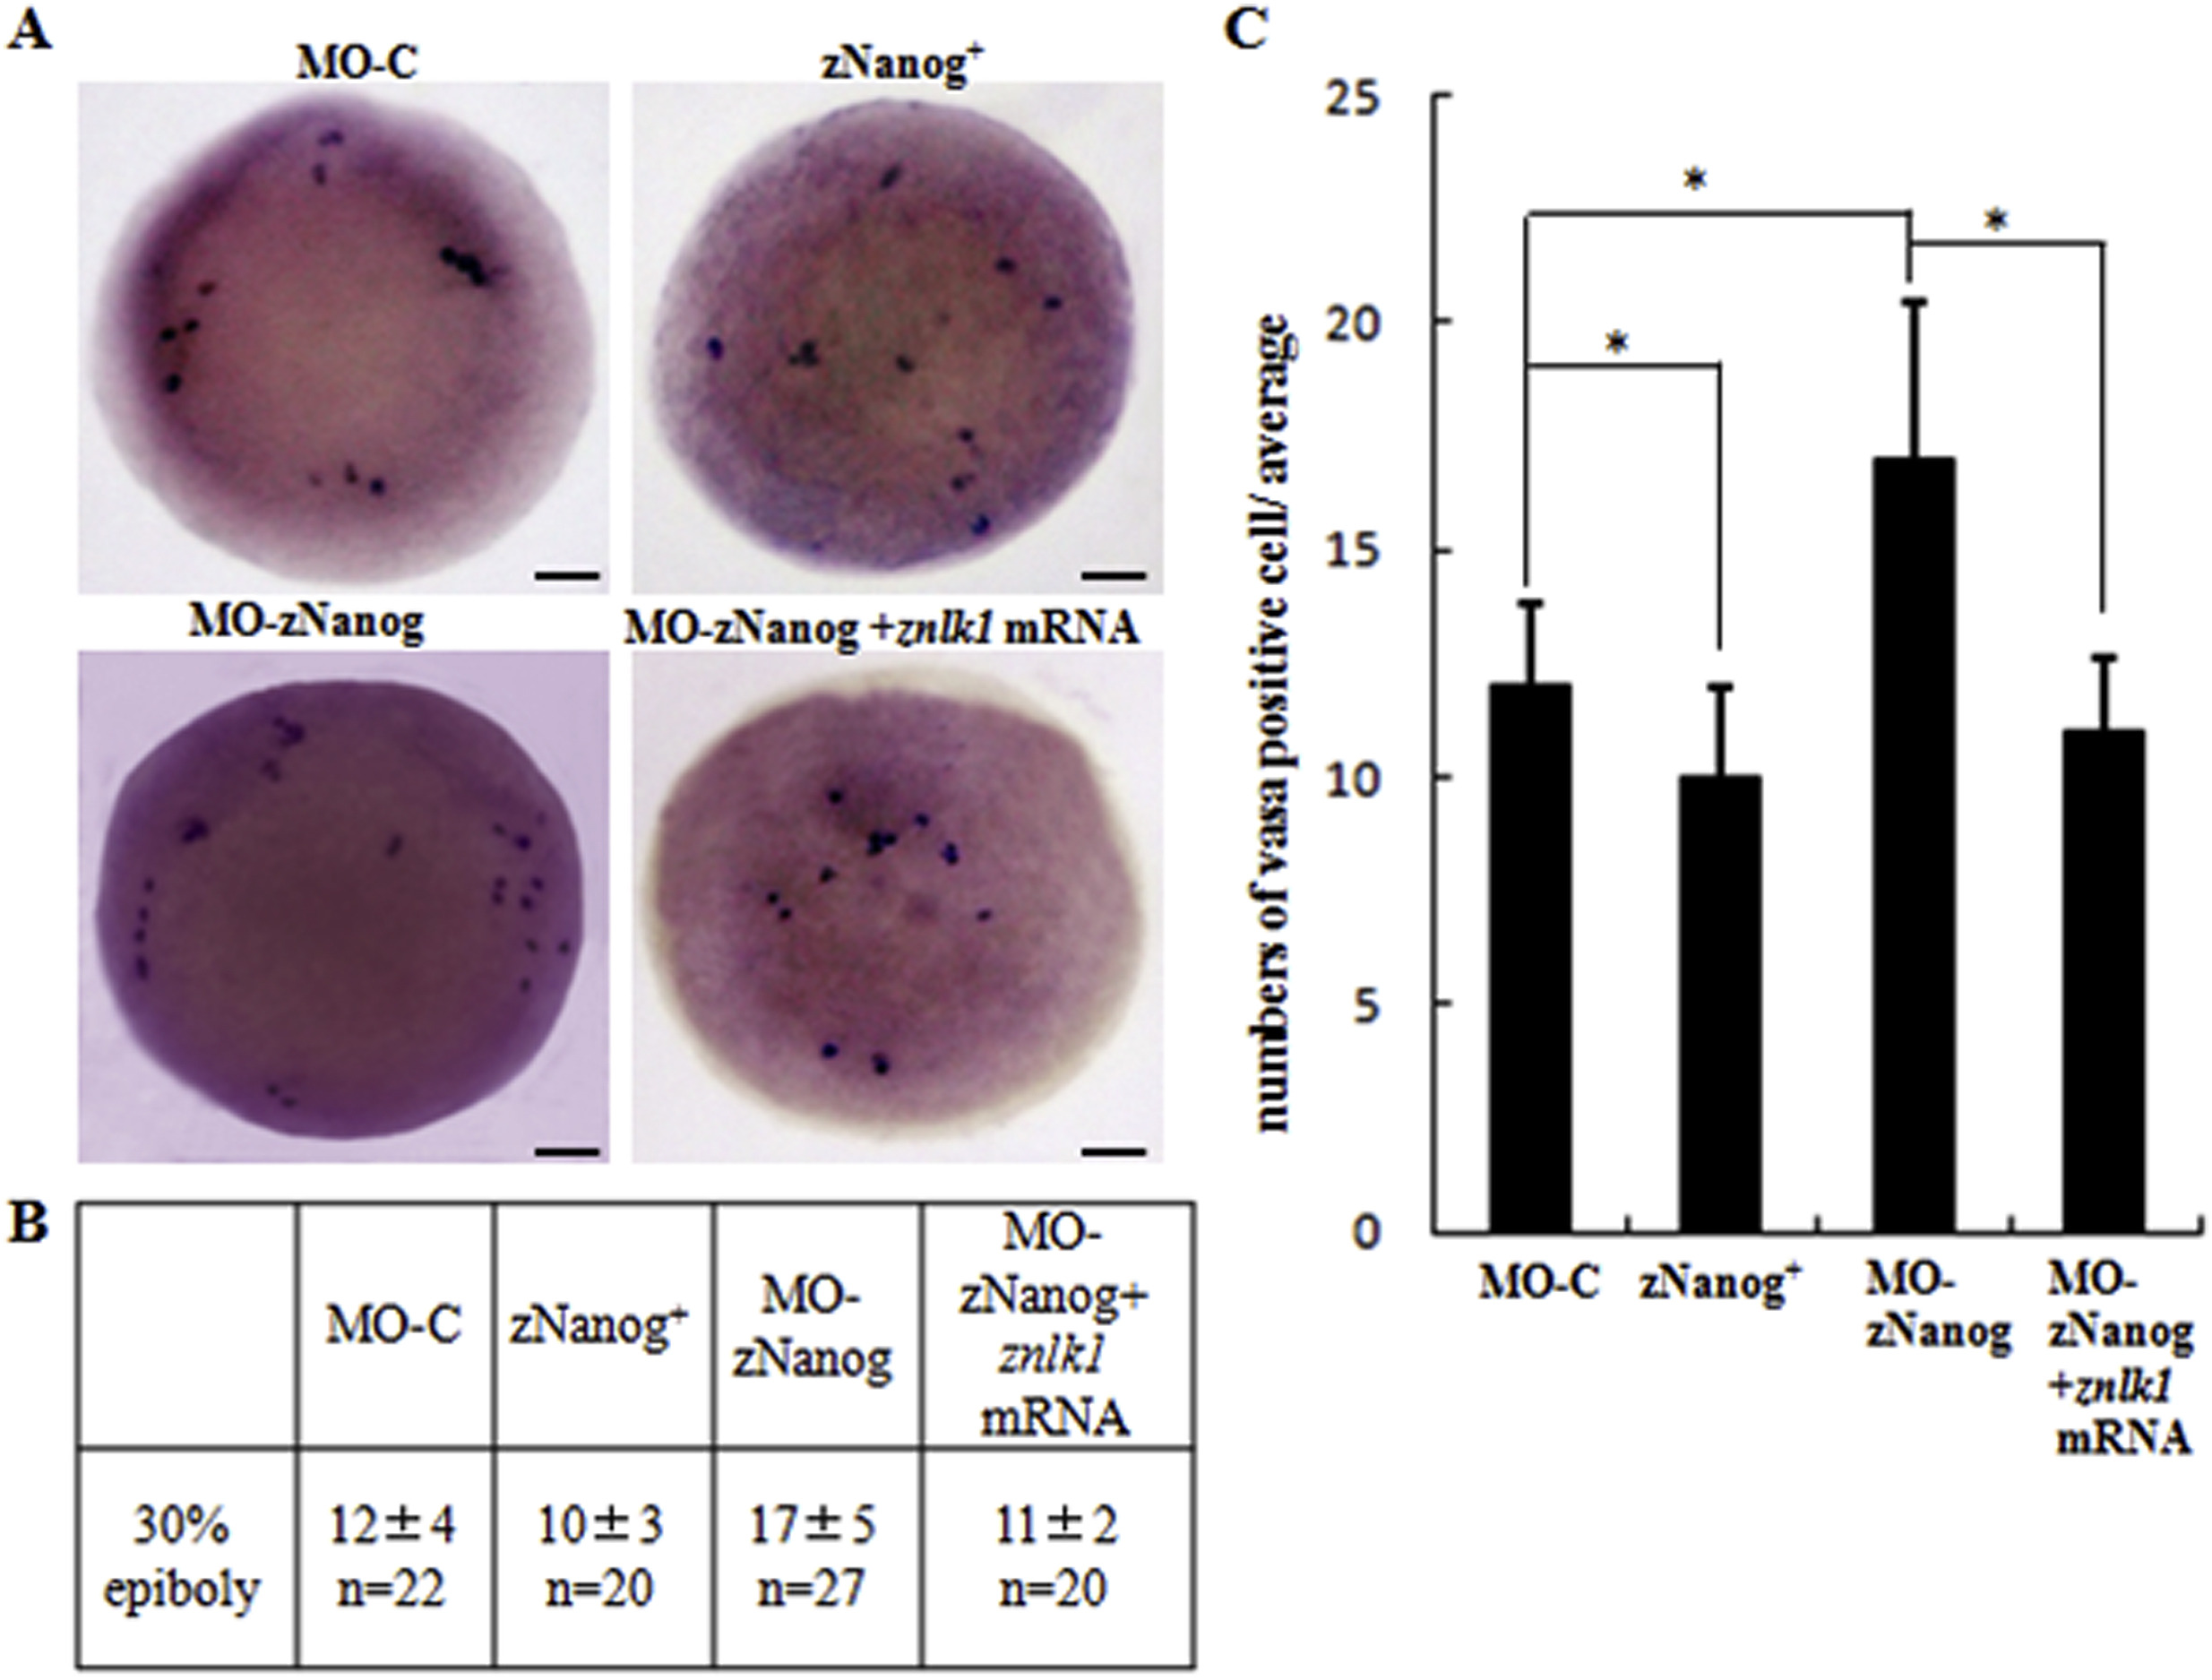
Fig. 7 The numbers of the vasa-positive cells in the embryos injected with MO-C, znanog mRNA, MO-zNanog, orMO-zNanog + znlk1 mRNA. A: Analysis of the numbers and localization of vasa-positive cells in the embryos injected with MO-C, znanog mRNA, MO-zNanog, orMO-zNanog + znlk1 mRNA by whole mount in situ hybridization. Scale bars: 0.5 mm in all panels. B: Numbers of vasa-positive cells in the embryos injected with MO-C, znanog mRNA, MO-zNanog, or MO-zNanog + znlk1 mRNA as detected by whole mount in situ hybridization. n: represents the total number of embryos from two different experiments. C: Numbers of vasa-positive cells in embryos as detected by whole mount in situ hybridization using vasa probes. Histogram representing the numbers of vasa-positive cells in MO-C, znanog mRNA, MO-zNanog, MO-zNanog + znlk1 mRNA embryos at 30% epiboly. All values represent the mean ± SEM from two independent experiments. *P < 0.05.