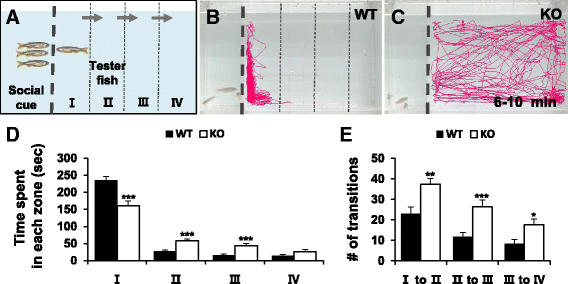
Fig. 4
Social interaction assay showing impaired social behavior in dyrk1aa KO zebrafish. a Here, three fish were used as a social cue against a tester fish. Bold dashed line indicates the position of the separator in the water tank. Three narrow dashed lines indicate the boundaries of four different zones (I, II, III, and IV) in the moving space of the tester fish, ranging from the most proximal to the most distal, respectively from the social cue fish group. Arrows indicate the transition of tester fish between zones. b, c Video tracking of 5-min movements of WT or dyrk1aa KO fish, showing the social interaction with the social cue. d Duration time for tester fish in each different zone. Black bars for WT fish and white bars for KO mutant fish. e Number of transit movements of tester fish at each zone boundary; movement from “I” to “II”, “II” to “III”, and “III” to “IV” zone. Number of tester fish used in this assay: n = 30 for WT fish, n = 30 for KO fish, respectively. Data are presented as mean ± SEM. * p < 0.05, ** p < 0.01, *** p < 0.001 by Student’s t test

