
Fig. 1
|
Fig. 1
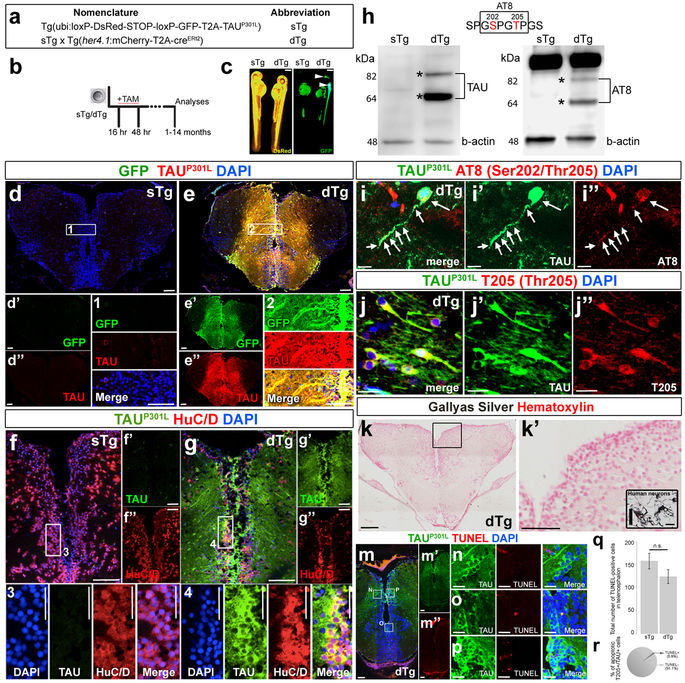
(a) Naming of transgenic constructs: sTg – effector transgenic, dTg – double transgenic. (b) Scheme for timing of recombination and analyses. (c) sTg and dTg animals (5 days post fertilization) treated with tamoxifen. DsRed expression indicates the presence of the effector cassette. Note the recombination in the central nervous system by GFP expression. (d) Immunohistochemistry (IHC) for GFP and TAUP301L on coronal sections of telencephalon of a 6 month-old sTg animal. Single channel images of the whole section for GFP (d’) and TAU (d”). (1) is the enlarged view of the inset in d. (e) IHC for GFP and TAUP301L on coronal sections of telencephalon of a 6-month old dTg animal. Single channel images of the whole section for GFP (e’) and TAU (e”). (2) is the enlarged view of the inset in f. (f) IHC for HuC/D and TAUP301L on coronal sections of telencephalon of an sTg animal. Single channel images of the whole section for TAU (f’) and HuC/D (f”). (3) is the enlarged view of the inset in f. (g) IHC for HuC/D and TAUP301L on coronal sections of telencephalon of a dTg animal. Single channel images of the whole section for TAU (g’) and HuC/D (g”). (4) is the enlarged view of the inset in g. (h) Western blot analyses for expression of TAUP301L (left) and hyperphosphorylated TAUP301L (right) in telencephalon. Beta actin is used as a loading control. (i) IHC for GFP and AT8 in a dTg animal. Individual channels are shown for GFP (i’) and AT8 (i”). Arrows represent the cytoplasmis signal. (j) IHC for TAUP301L and T205 in a dTg animal. Individual channels are shown for TAUP301L (j’) and T205 (j”). (k) Gallyas silver (black) and Hematoxylin (pink) staining in telencephalon of a dTg animal. (k’) Enlarged region in k’. Note the absence of Gallyas silver-positive cells. (l) Positive control for Gallyas silver staining in human neurons treated with Amyloid, showing neurofibrillary tangles. (m) Immunohistochemistry for TAUP301L (green) combined with TUNEL detection of apoptotic cells (red) in recombined 6 months old dTg animals. Individual fluorescent channels are shown in m’ and m”. (n–p) Higher magnification images from the insets in m. (q) Quantification of TUNEL-positive cells in the telencephalon in sTg and dTg animals. (r) Quantification of apoptotic cells containing hyperphosphorylated TAUP301L (T205-positive). Values represent mean ± s.e.m. *p < 0.05, **p < 0.01, ***p < 0.005. Scale bars equal 10 μm (i–j’) and 50 μm elsewhere. n = 6 fish and > 30 histological sections for every staining. Larvae are 5 days old, and adult animals are 6 months old.