
Image
|
Figure Caption
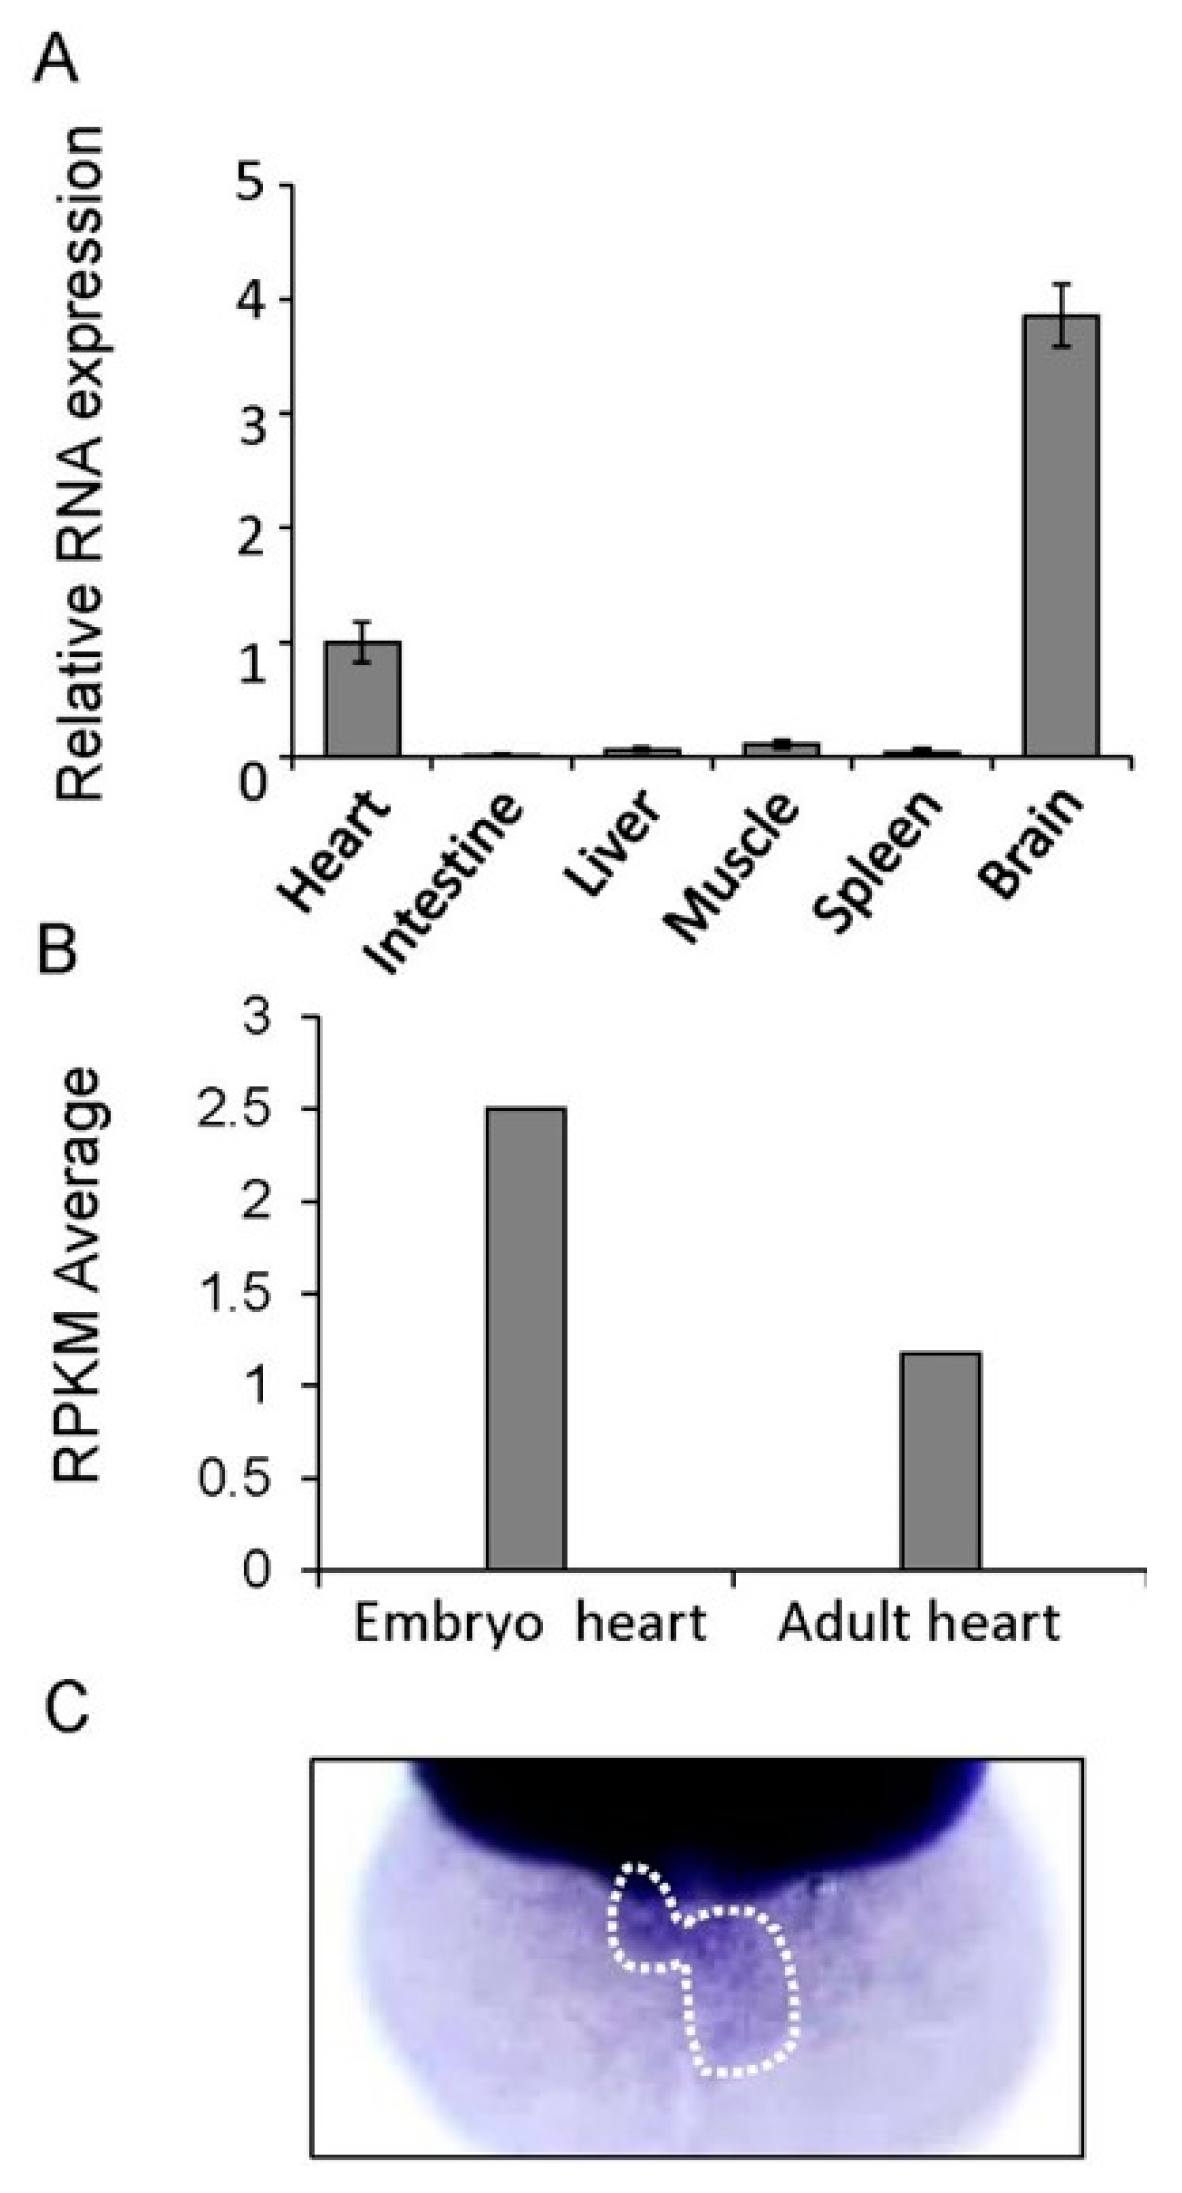
Fig. 2
Assessment of the cardiac expression of gatad1 in zebrafish. (A) The relative expression level of gatad1 in different tissues were revealed by real-time RT-PCR using 18s as internal control. Cardiac expression was defined as 1 and used as a reference. The brain has the highest gatad1 expression; (B) Different expression levels of gatad1 in embryonic and adult zebrafish hearts were revealed by RNA sequencing. gatad1 expression in the embryonic heart is higher than that in the adult heart; (C) Cardiac expression of gatad1 transcripts was also revealed by in situ hybridization in 2 dpf zebrafish embryos. RPKM: number of reads per kilobase per million reads.
Figure Data
Acknowledgments
This image is the copyrighted work of the attributed author or publisher, and
ZFIN has permission only to display this image to its users.
Additional permissions should be obtained from the applicable author or publisher of the image.
Full text @ J Cardiovasc Dev Dis