
|
Fig. S8
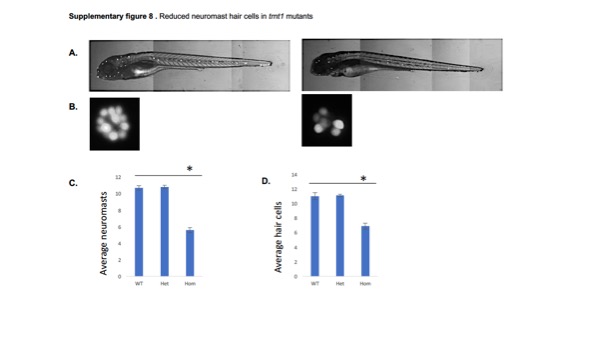
Reduced neuromast hair cells in trnt1 mutant embryos
A. Fluorescent images of WT (left) and mutant (right) embryos at 5 dpf stained with Yopro-1, showing the location of neuromasts. Both embryos are shown with their head to the left. B. Magnified images of hair cells in an individual neuromast in the WT and mutant embryos. C-D. Quantification of neuromast numbers (C) and hair cell numbers (D) in embryos from het in-crosses. Both graphs show the average and the standard error of the mean. The reduction in the number of neuromasts and hair cells is significant in the mutant (t-test, p <0.001). Both alleles had similar phenotypes, phenotype for del10 allele is shown here.