
|
Fig. S7
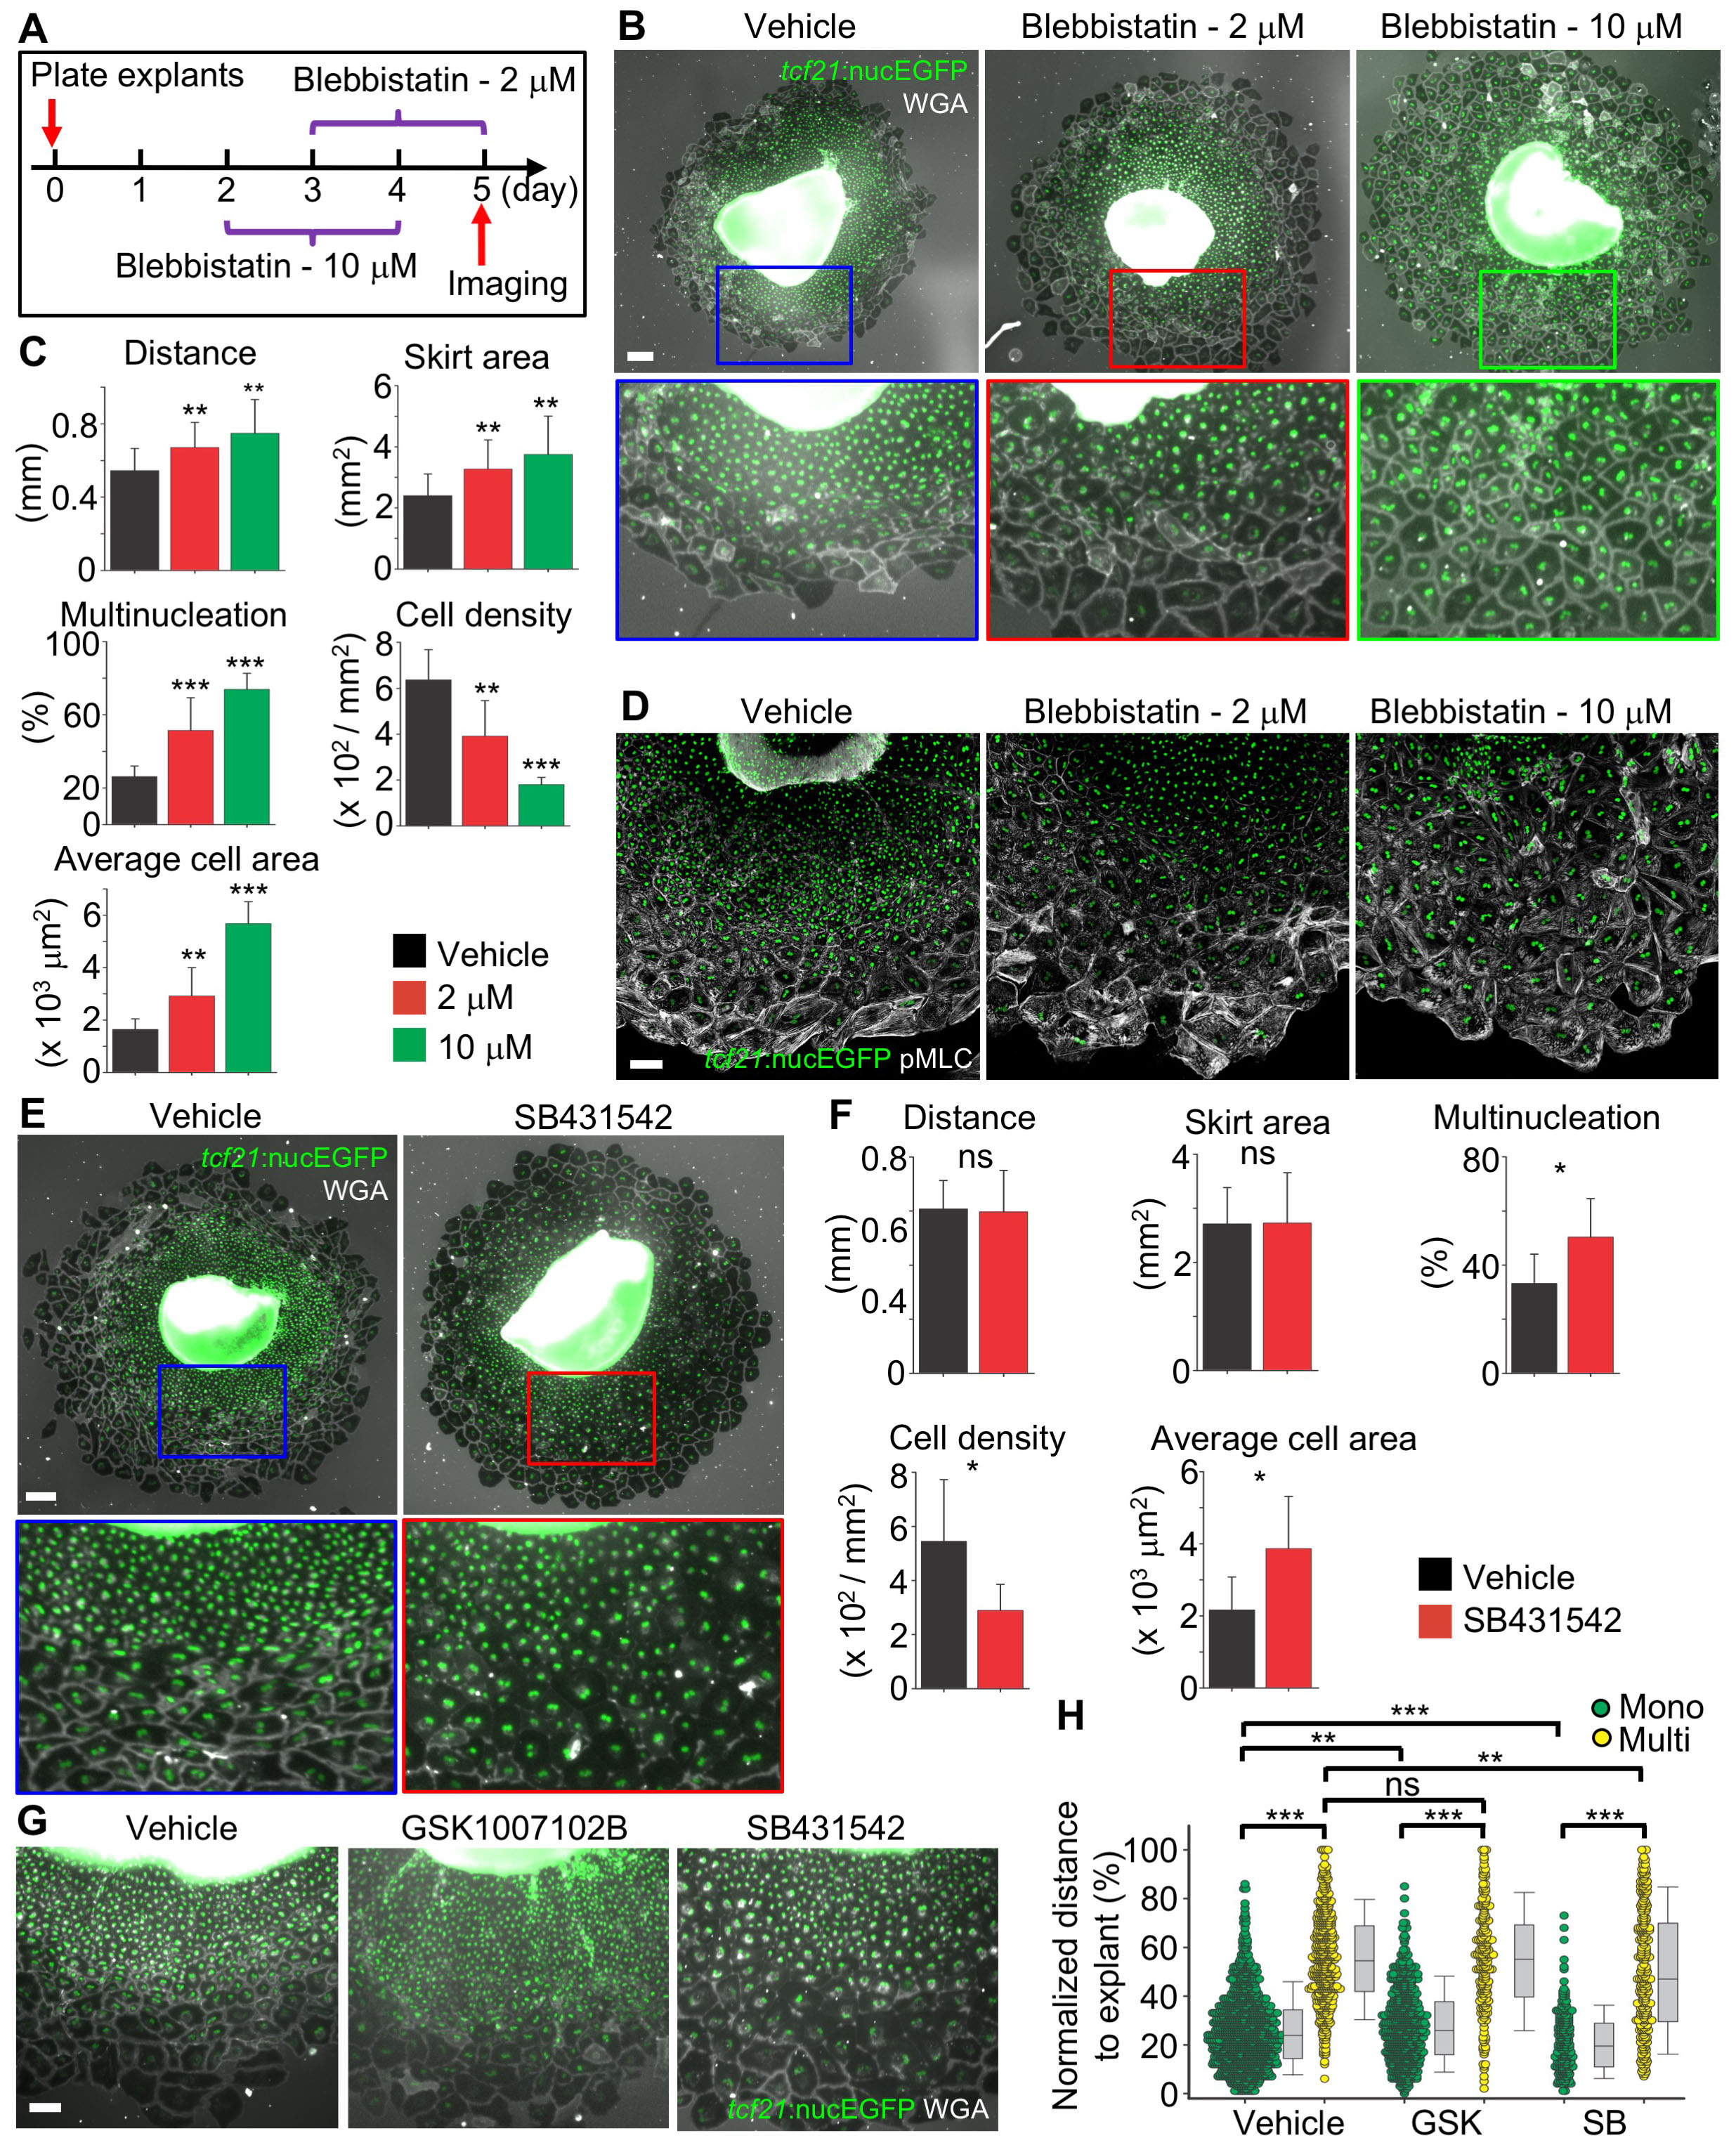
Chemical Treatment of Epicardial Explant Cultures (Related to Figure 7)
(A) Schematic for experimental design in (B-D). tcf21:nucEGFP explants were plated for 5 days. Blebbistatin was added from day 3 to day 5 (2 μM) or from day 2 to day 4 (10 μM). Images were acquired and analyzed at day 5.
(B) Epicardial explant culture assays with Vehicle or Blebbistatin (2 μM or 10 μM) treatment as shown in (A). Framed regions are enlarged below to show details. tcf21:nucEGFP is shown in green, WGA staining is shown in grayscale. Scale bar, 200 μm. (C) Quantification of epicardial tissue growth in (B). For migration distance and skirt area, n = 20 (Vehicle), 20 (2 μM), and 18 (10 μM) explants, respectively. For nucleation, cell density, and average cell area, n = 10 explants for each treatment. *** P < 0.001; ** P < 0.01; Mann-Whitney Rank Sum Test. All comparisons were versus Vehicle-treated group. Bars indicate mean ± S.D.
(D) Epicardial explant culture in (A) was stained with pMLC (Ser19, grayscale). Scale bar, 100 μm.
(E) Epicardial explant culture assays with Vehicle or SB431542 (10 μM) treatment. tcf21:nucEGFP explants (shown in green) were plated for 5 days. WGA staining is used to outline cells (grayscale). Drug was added from day 0 to day 5. Framed regions are enlarged below to show details. Scale bar, 200 μm.
(F) Quantification of epicardial tissue growth in (E). For migration distance and skirt area, n = 20 explants for each. For nucleation, cell density, and average cell area, n = 10 explants for each treatment. * P < 0.05; ns, not significant; Mann-Whitney Rank Sum Test. Bars indicate mean ± S.D.
(G) Epicardial explant culture assays with Vehicle, GSK1007102B (0.5 μM) or SB431542 (10 μM) treatment. tcf21:nucEGFP explants (shown in green) were plated for 5 days. WGA staining is used to outline cells (grayscale). Drugs were added from day 0 to day 5. Scale bar, 100 μm.
(H) Spatial distribution of nucleation after treatment with Vehicle, GSK1007102B (GSK), or SB431542 (SB) as shown in (G). n = 1,481 (Vehicle), 819 (GSK), and 439 (SB) cells, respectively. *** P < 0.001; ns, not significant; Mann-Whitney Rank Sum Test. Bars indicate S.D.
Reprinted from Developmental Cell, 42, Cao, J., Wang, J., Jackman, C.P., Cox, A.H., Trembley, M.A., Balowski, J.J., Cox, B.D., De Simone, A., Dickson, A.L., Di Talia, S., Small, E.M., Kiehart, D.P., Bursac, N., Poss, K.D., Tension Creates an Endoreplication Wavefront that Leads Regeneration of Epicardial Tissue, 600-615.e4, Copyright (2017) with permission from Elsevier. Full text @ Dev. Cell