
|
Fig. S5
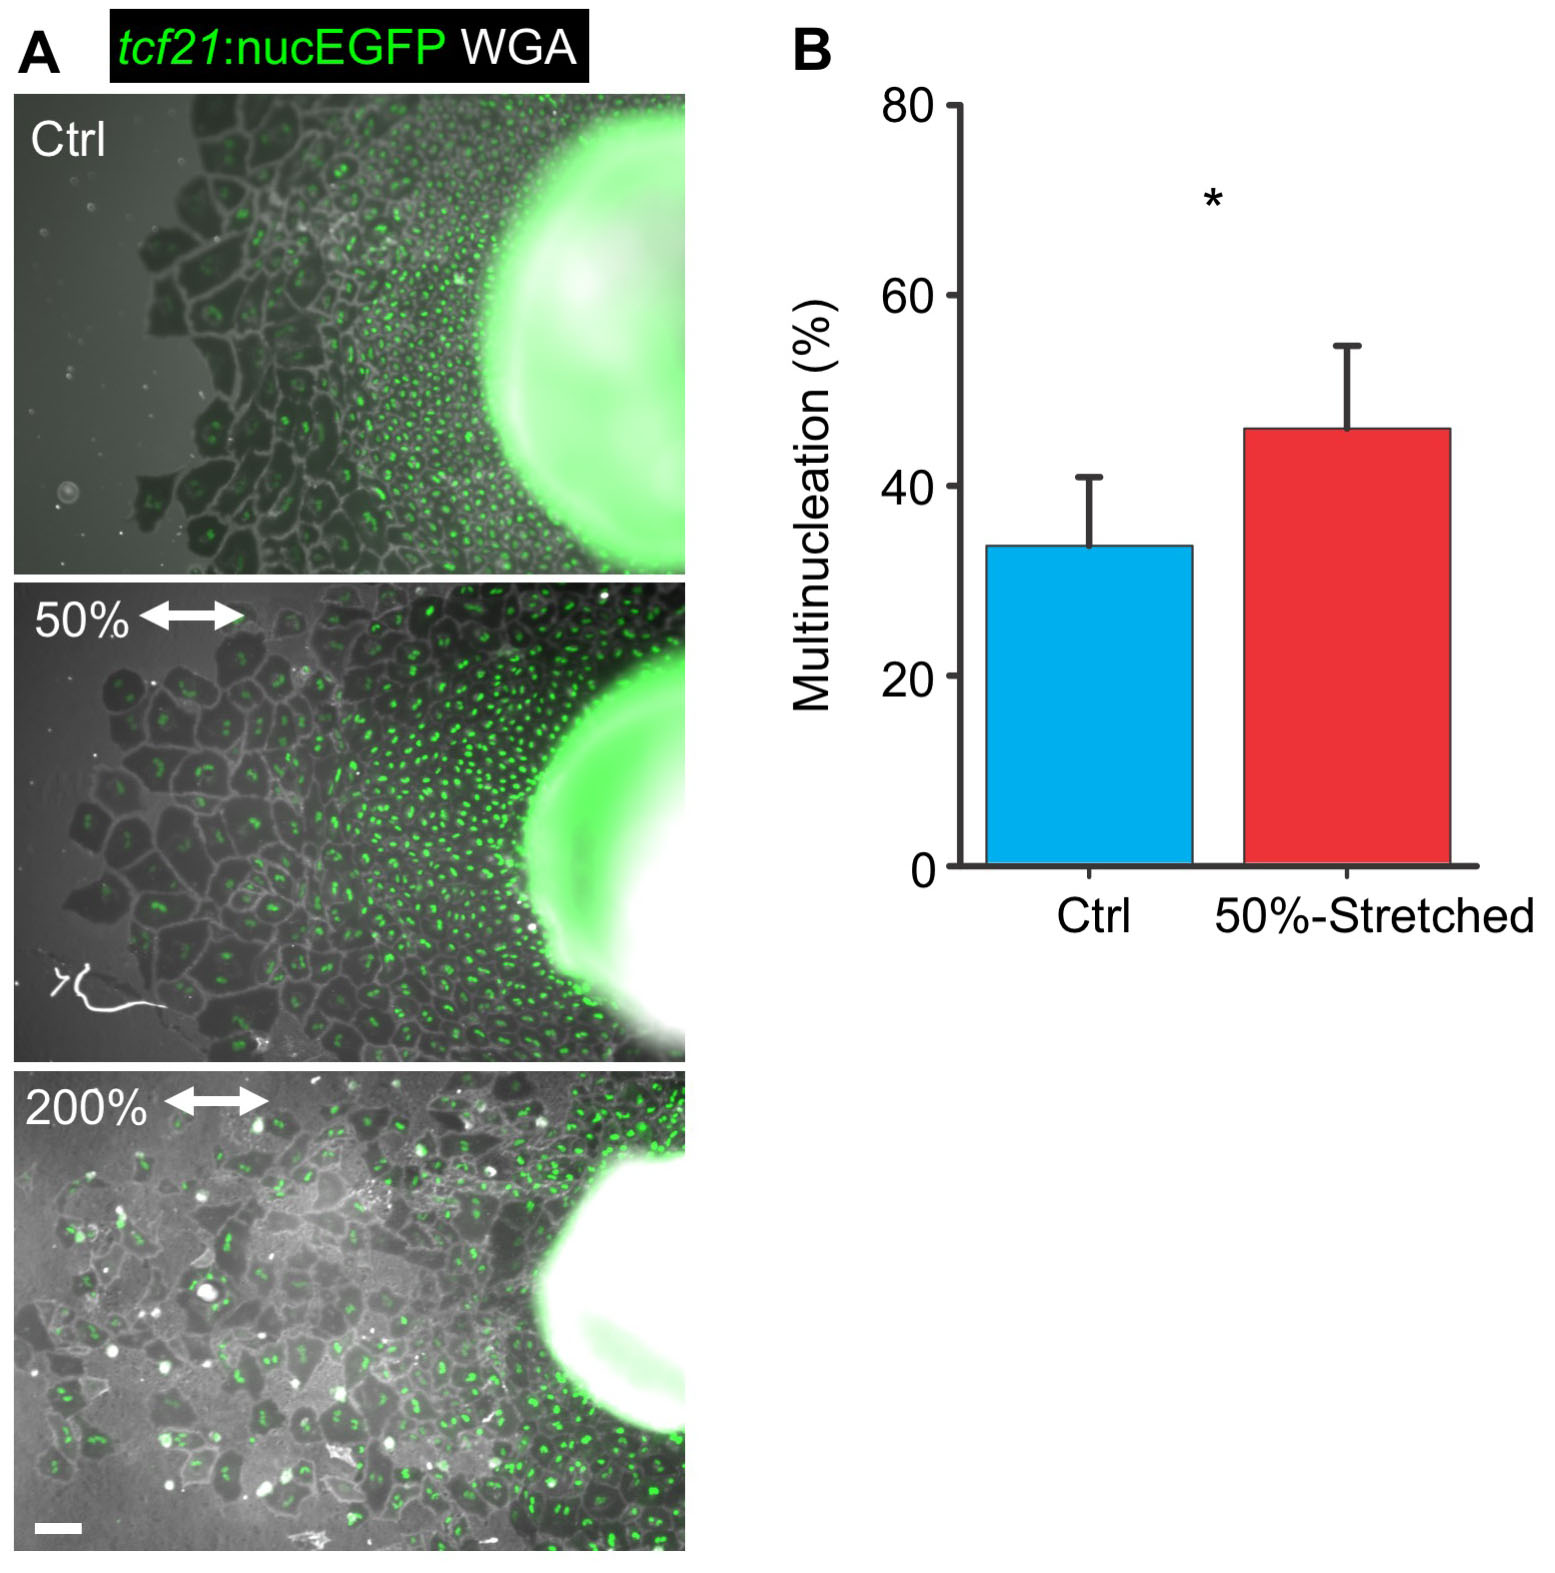
Mechanical Stretching of Epicardial Sheets (Related to Figure 5)
(A) The same experiment as shown in Figure 5, using tcf21:nucEGFP tissue with cell shapes outlined with a WGA staining (grayscale). (Top) Unstretched control. (Middle) Explants after 50% stretch. (Bottom) Explants after 200% stretch, which typically damaged the tissue. The dual arrow indicates stretch direction. Scale bars, 100 μm.
(B) Quantification of epicardial cell multinucleation within a quadrant of the epicardial sheet shown in (A) after 50% stretch. n = 8 (Ctrl) and 7 (Stretched) explants. * P < 0.05, Mann-Whitney Rank Sum Test. Bars indicate mean ± S.D.
Reprinted from Developmental Cell, 42, Cao, J., Wang, J., Jackman, C.P., Cox, A.H., Trembley, M.A., Balowski, J.J., Cox, B.D., De Simone, A., Dickson, A.L., Di Talia, S., Small, E.M., Kiehart, D.P., Bursac, N., Poss, K.D., Tension Creates an Endoreplication Wavefront that Leads Regeneration of Epicardial Tissue, 600-615.e4, Copyright (2017) with permission from Elsevier. Full text @ Dev. Cell