
|
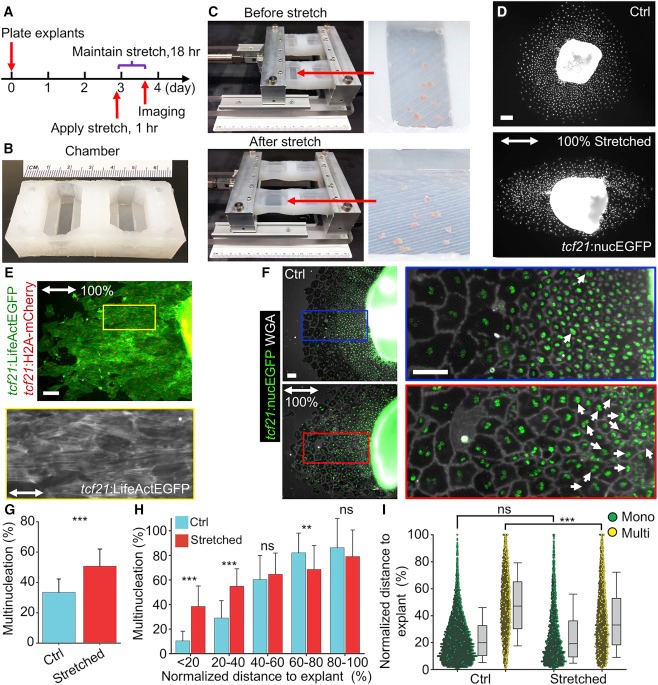
Fig. 5 Mechanical Tissue Stretching Promotes Epicardial Endoreplication
(A) Schematic of experimental design in (C) to (F).
(B) An elastic chamber with culture surface areas of 7 × 23 mm2 (right) and 7 × 26 mm2 (left).
(C) Culture chambers before stretch (top) and after stretch (bottom). Enlarged views of a chamber with heart explants and PBS are shown on the right.
(D) Explant culture from tcf21:nucEGFP animals with (bottom) or without (top) 100% stretch. The double arrow indicates stretch direction. nucEGFP is shown in white. Scale bars, 100 μm.
(E) Explant culture from tcf21:LifeAct-EGFP;tcf21:H2A-mCherry animals after 100% stretch. (Top) LifeAct-EGFP is shown in green and H2A-mCherry in red. The framed region is enlarged to show LifeAct-EGFP (grayscale) below. The double arrow indicates stretch direction. Scale bars, 100 μm.
(F) Experiment as in (D) is shown, visualizing tcf21:nucEGFP tissue with cell shapes outlined using a wheat germ agglutinin stain (grayscale). Top, unstretched control; bottom, 100% stretch. The double arrow indicates stretch direction. White arrows denote multinucleate cells close to the explant. Scale bars, 100 μm.
(G) Quantification of epicardial cell multinucleation in a quadrant of the cell sheet shown in (F). n = 28 (Ctrl) and n = 26 (Stretched) explants. ∗∗∗p < 0.001, Mann-Whitney rank-sum test. Error bars indicate mean ± SD.
(H) Distribution plot showing the percentages of multinucleate cells at different regions of the epicardial cell sheet for both unstretched (Ctrl) and stretched cultures. Distances of cells to explant were normalized to the migration distances of the cell sheets and expressed as a percentage. n = 27 (Ctrl) and n = 31 (Stretched) explants. ∗∗∗p < 0.001; ∗∗p < 0.01; ns, not significant; Mann-Whitney rank-sum test. Error bars indicate mean ± SD.
(I) Frequency plot showing the distances of cells to explants for mononucleate (Mono, green) and multinucleate (Multi, yellow) cells, respectively, for both unstretched (Ctrl) and stretched cultures. Distances of cells to explant were normalized to the migration distances of the cell sheets and expressed as a percentage. n = 7,183 (Ctrl, Mono), 3,390 (Ctrl, Multi), 3,959 (Stretched, Mono), and 3,994 (Stretched, Multi) cells, respectively. ∗∗∗p < 0.001, Mann-Whitney rank-sum test. Error bars indicate SD.
See also Figure S5.
Reprinted from Developmental Cell, 42, Cao, J., Wang, J., Jackman, C.P., Cox, A.H., Trembley, M.A., Balowski, J.J., Cox, B.D., De Simone, A., Dickson, A.L., Di Talia, S., Small, E.M., Kiehart, D.P., Bursac, N., Poss, K.D., Tension Creates an Endoreplication Wavefront that Leads Regeneration of Epicardial Tissue, 600-615.e4, Copyright (2017) with permission from Elsevier. Full text @ Dev. Cell