
|
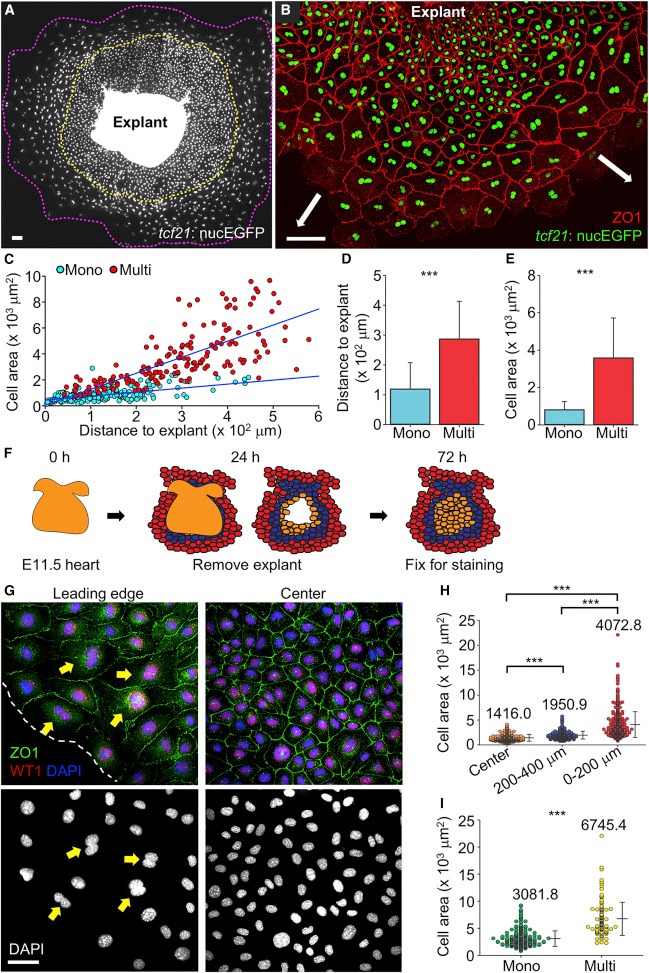
Fig. 2 Emergence of Leader and Follower Cells Ex Vivo
(A) tcf21:nucEGFP epicardial cells migrating from an explant after 5 days of culture in a coated dish. The front of the leading edge is outlined with a magenta dashed line, and the mononucleate cell domain is outlined with a yellow dashed line. Scale bar, 100 μm.
(B) tcf21:nucEGFP explant culture stained for ZO1. White arrows indicate direction of migration. Scale bar, 100 μm.
(C) Quantification of cell area and distance to the explant for samples in (B). Mononucleate cells are represented by cyan dots and multinucleate cells by red dots. n = 224 (Mono) and n = 166 (Multi). The blue lines show regression results for Mono and Multi, respectively. p < 0.001, ANCOVA.
(D and E) Distribution of cell distances to explant (D) and cell areas (E) for mononucleate (Mono) and multinucleate cells (Multi). n = 224 (Mono) and n = 166 (Multi). ∗∗∗p < 0.001, Mann-Whitney rank-sum test. Error bars indicate mean ± SD.
(F–I) Polyploidy and hypertrophy of murine fetal epicardial cells. (F) Schematic of murine epicardial explant culture. The colors indicate location of regions quantified in (H). (G) A 72-hr culture stained for WT1 (red) and ZO1 (green) indicating epicardial cells at the leading edge (left) or the center (right). Nuclear staining is blue in merged images and white in bottom panels. Yellow arrows denote binucleate cells. (H) Quantification of cell areas at three different regions. n = 352 (center), 299 (200–400 μm from the front of leading edge), and 451 (0–200 μm), respectively. Numbers on the plot indicate mean values. (I) Quantification of cell areas at the leading edge (0–200 μm from the front) for mononucleate (Mono, n = 329) and multinucleate (Multi, n = 122) cells. Numbers on the plot indicate mean values. ∗∗∗p < 0.001, Mann-Whitney rank-sum test. Error bars indicate mean ± SD. Scale bar, 50 μm.
See also Figure S3.
Reprinted from Developmental Cell, 42, Cao, J., Wang, J., Jackman, C.P., Cox, A.H., Trembley, M.A., Balowski, J.J., Cox, B.D., De Simone, A., Dickson, A.L., Di Talia, S., Small, E.M., Kiehart, D.P., Bursac, N., Poss, K.D., Tension Creates an Endoreplication Wavefront that Leads Regeneration of Epicardial Tissue, 600-615.e4, Copyright (2017) with permission from Elsevier. Full text @ Dev. Cell