
Image
|
Figure Caption
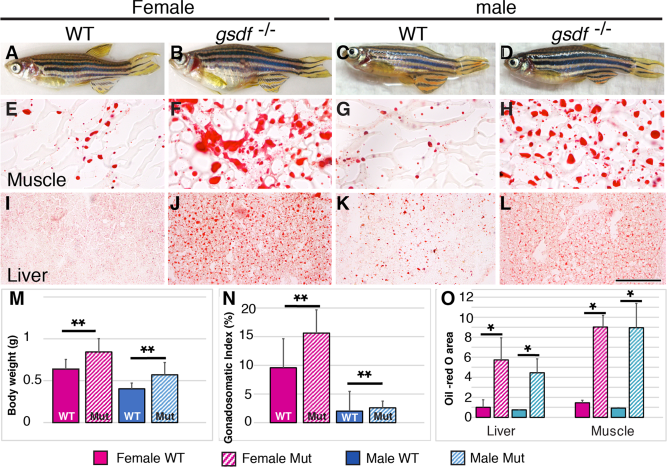
Fig. 6 Body size and lipid homeostasis. A–D: Adult 8 mpf zebrafish: wild-types (A, female; C, male) and gsdf mutants (B, female; D, male), showing enlarged abdomens in mutants. E–L: Histological sections showing lipid stained with Oil Red O in trunk muscle (E–H) and hepatopancreas (liver; I–L). Mutants accumulated more and larger lipid droplets than wild-types. M: Body weight (g). N: Gonadosomatic index (%). O: Oil-red O area. Solid boxes, wild-types; striped boxes, mutants; red boxes, females; blue boxes, males. *0.05 < P < 0.01; **0.01 < P < 0.001. Scale bar = 100 μm in L.
Figure Data
Acknowledgments
This image is the copyrighted work of the attributed author or publisher, and
ZFIN has permission only to display this image to its users.
Additional permissions should be obtained from the applicable author or publisher of the image.
Full text @ Dev. Dyn.