
|
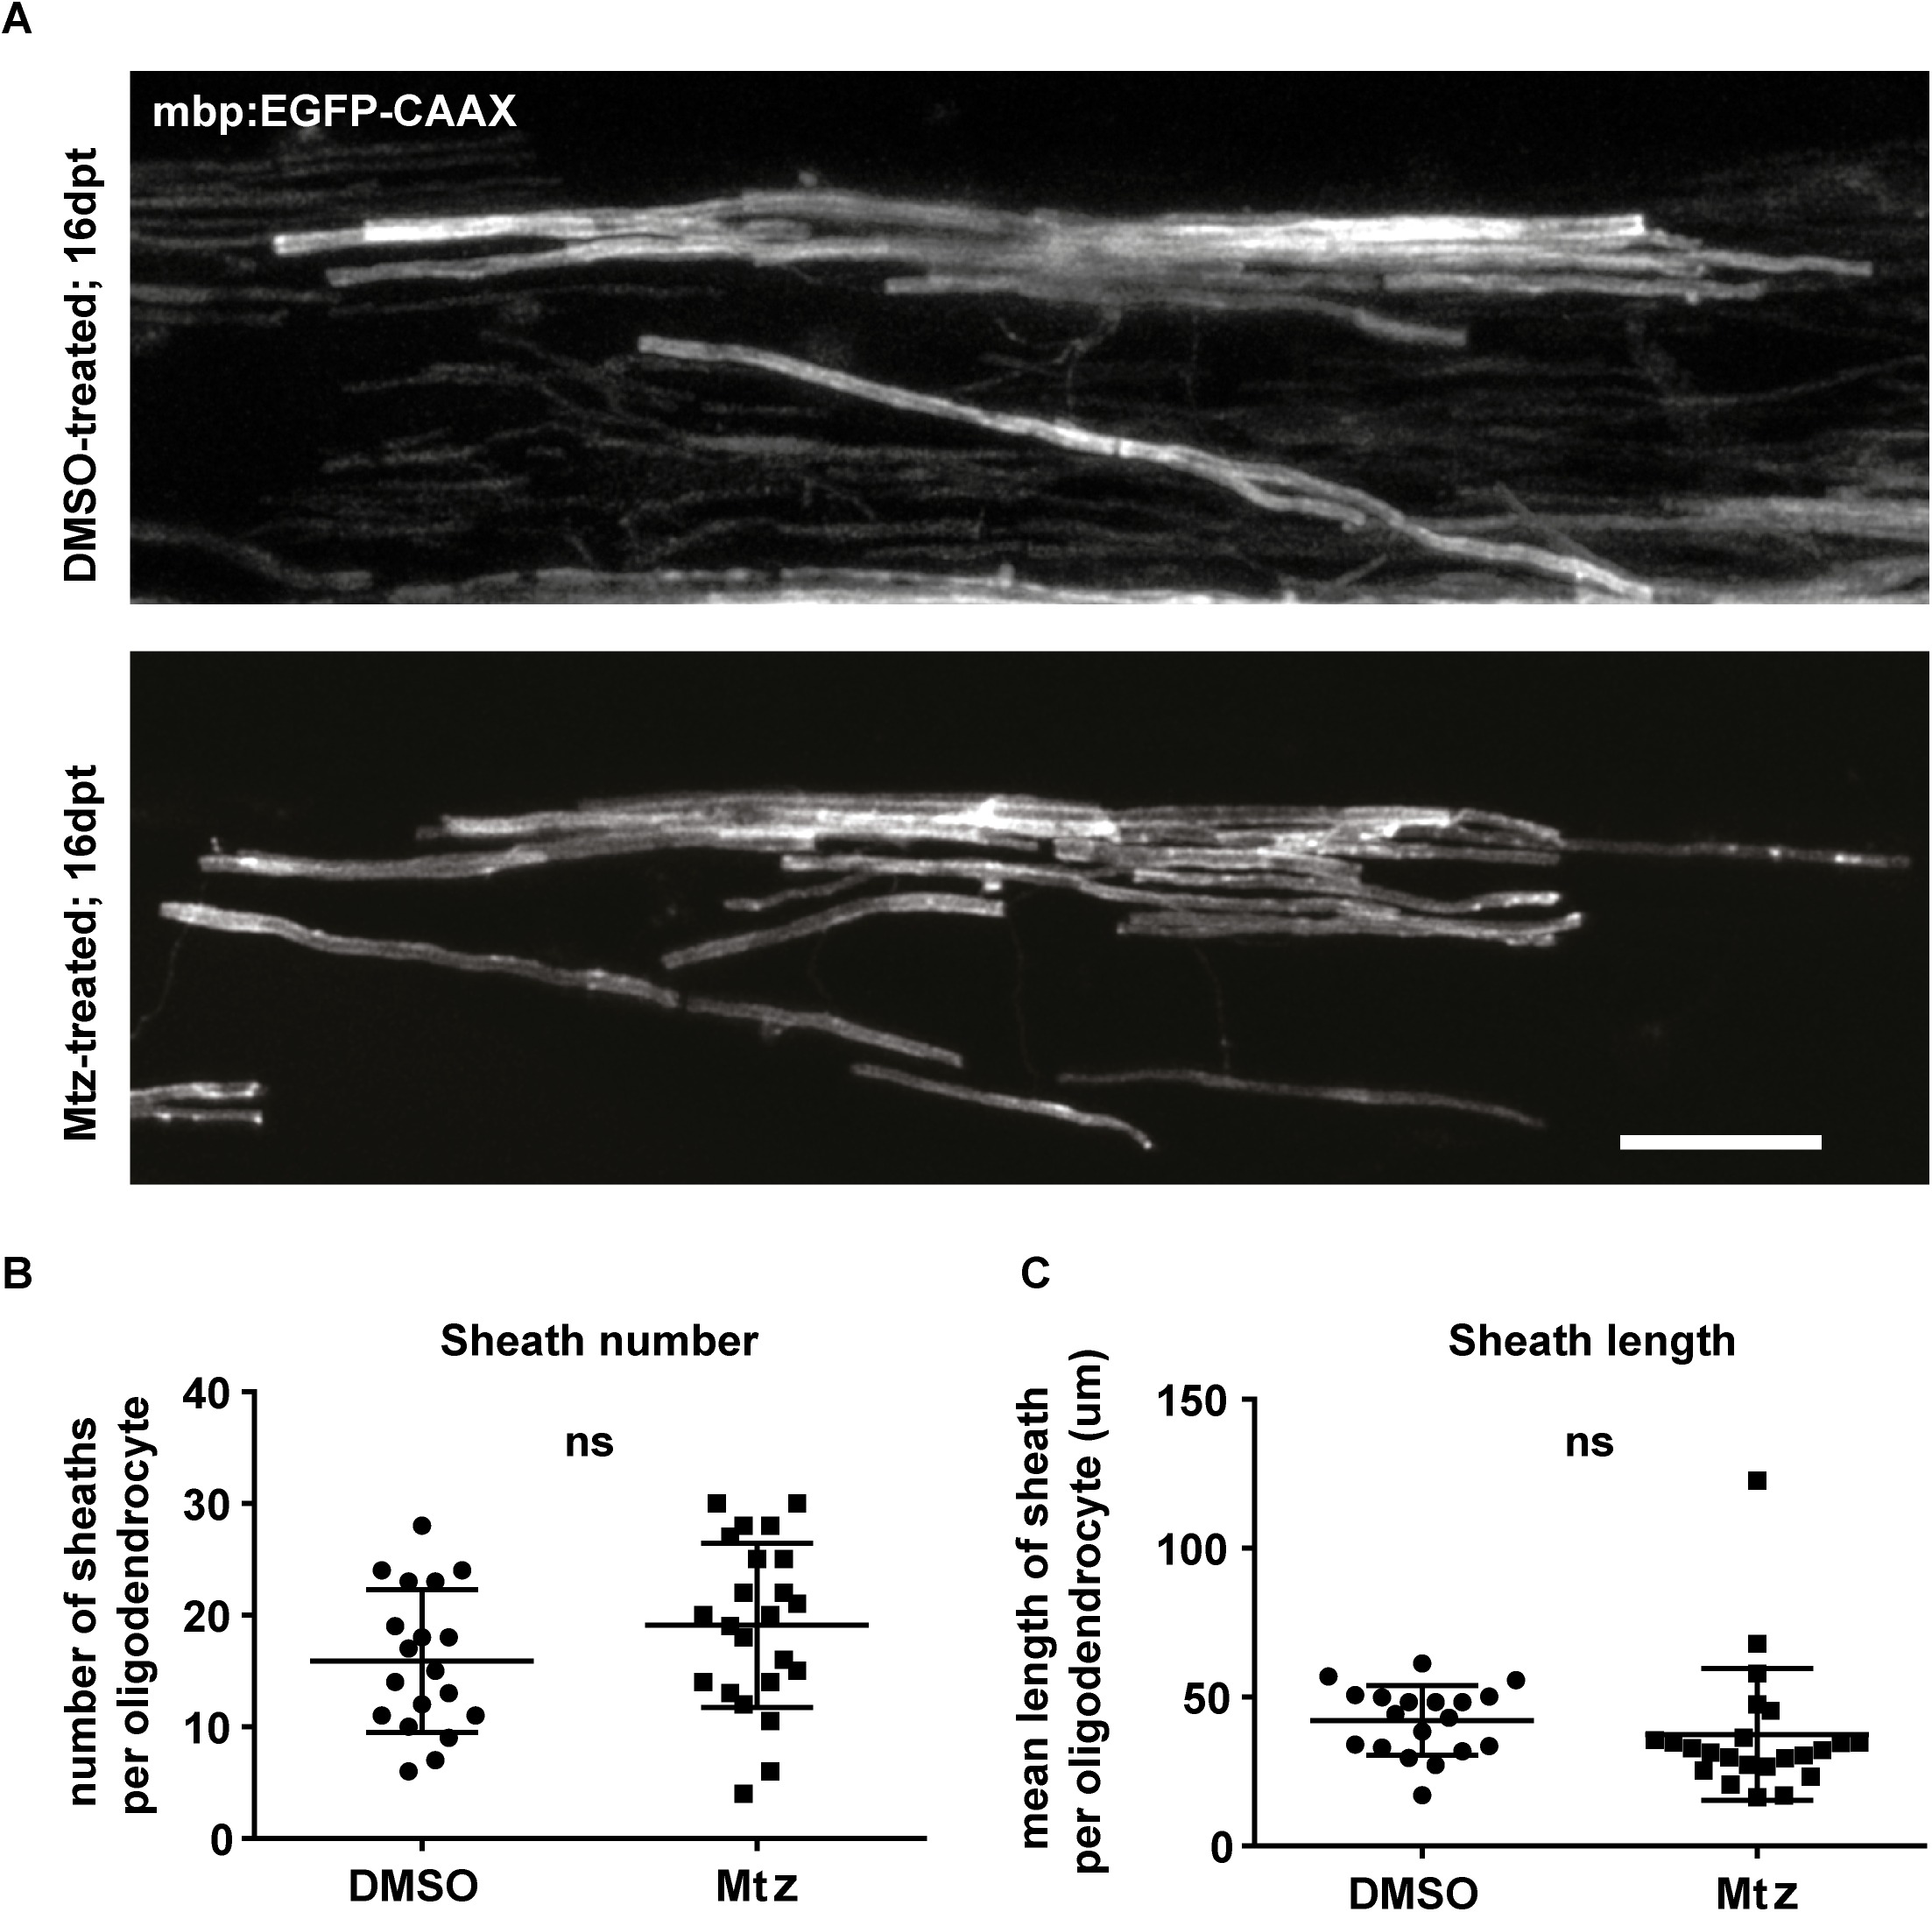
Fig. 8
Myelin sheath numbers and lengths per oligodendrocyte are not different between control and treated animals at the remyelinated stage.
A. Representative images of single oligodendrocytes in DMSO- or Mtz-treated Tg(mbp:mCherry-NTR) fish, labelled with mbp:EGFP-CAAX. Scale bar: 20μm. B. Quantification of the mean number of sheaths per oligodendrocyte in control and Mtz-treated animals: in controls: 15.89 ± 6.39, vs treated: 19.11 ± 7.36, p = 0.143 (t test). C. Quantification of the mean length of myelin sheath per oligodendrocyte: mean in controls. Mean length of sheath per oligodendrocyte; in controls: 42.21 ± 11.64 vs treated: 37.41 ± 22.14, p = 0.400. n = 19 cells (in 16 animals) for controls, 23 cells (in 19 animals) for treated animals.