
Image
|
Figure Caption
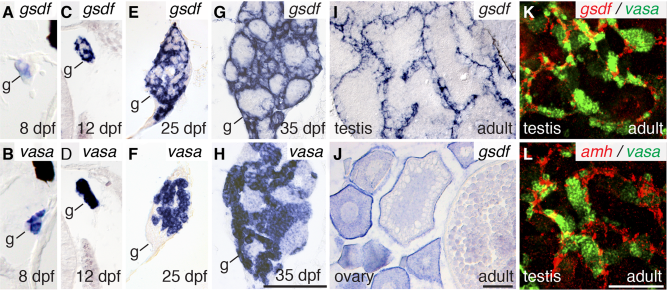
Fig. 1 Expression of gsdf in somatic cells (A,C,E,G) and vasa in germ cells (B,D,F,H) of 8 dpf (A,B), 12 dpf (C,D), 25 dpf (E,F), and 35 dpf (G,H) animals. Expression of gsdf in 8 mpf adult testis (I) and ovary (J). Two color in situ hybridization on adult testis (K) for gsdf (red) and vasa (green) and (L) amh (red) and vasa (green). Black scale bar in H for A–H; black scale bar in J for I,J; white scale bar in L for K,L. All scale bars = 100 μm.
Figure Data
Acknowledgments
This image is the copyrighted work of the attributed author or publisher, and
ZFIN has permission only to display this image to its users.
Additional permissions should be obtained from the applicable author or publisher of the image.
Full text @ Dev. Dyn.