
|
Fig. 2
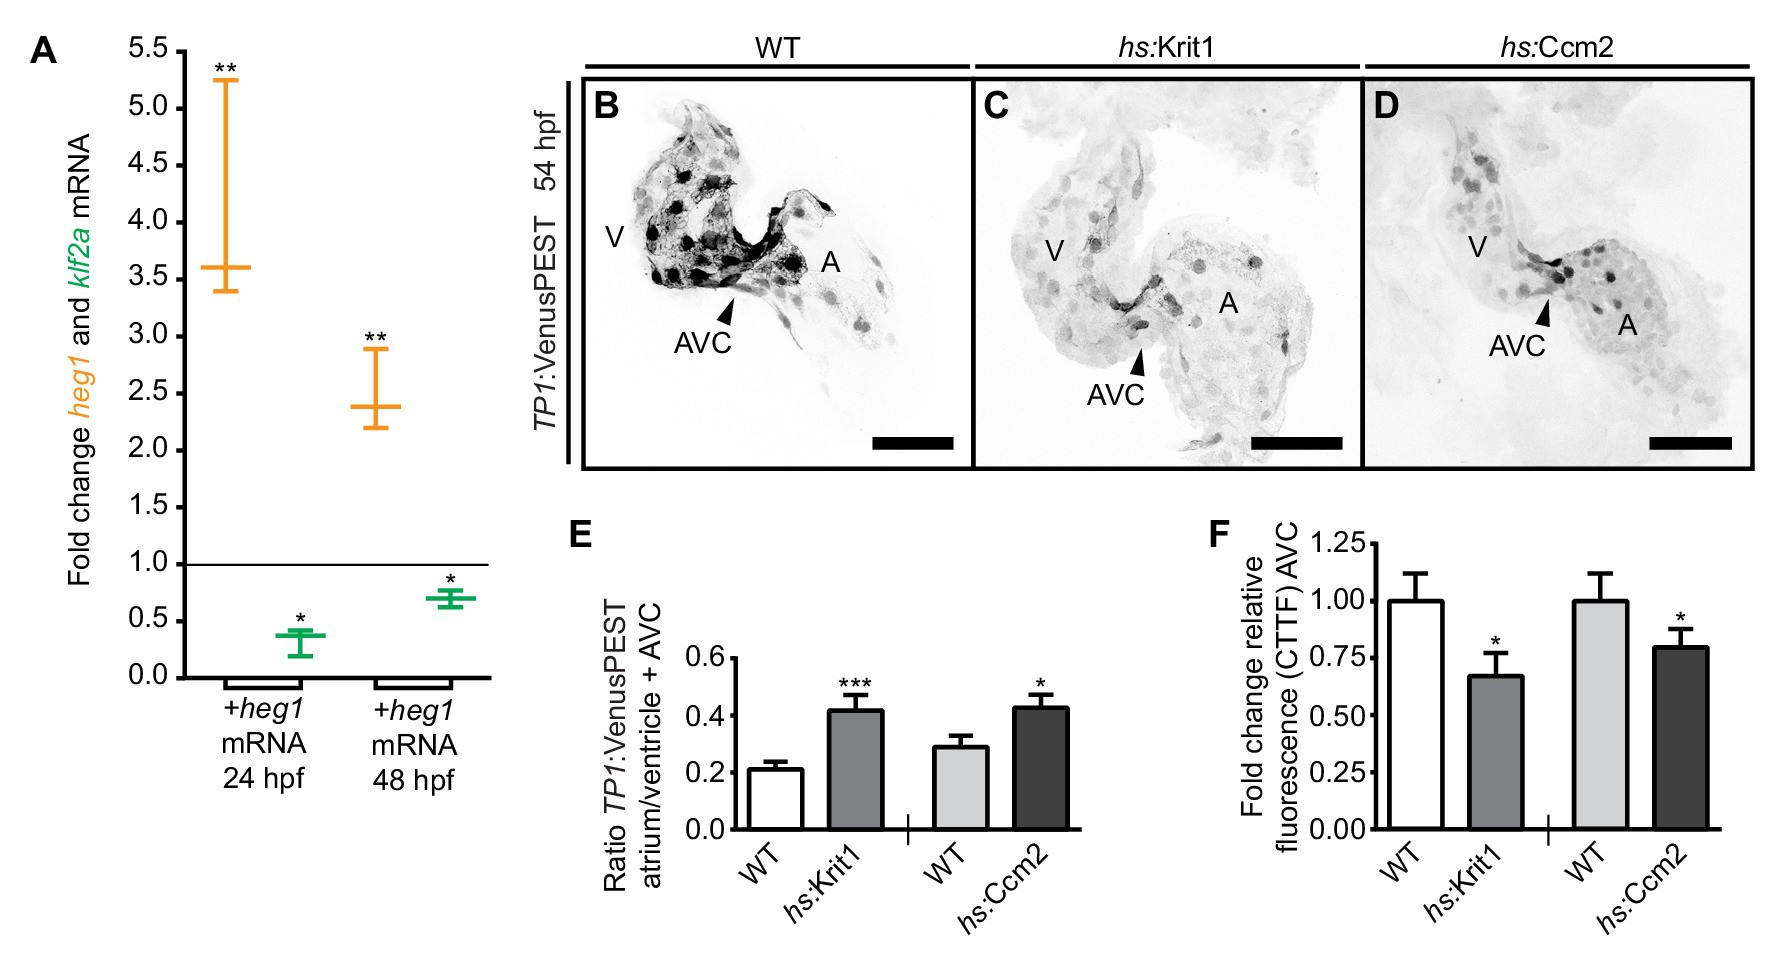
Desensitization of endocardial cells to blood-flow by heg1, krit1, or ccm2 overexpression.
(A) Correlation of high heg1 and low klf2a mRNA expression levels at 24 and 48 hpf as determined by RT-qPCR. (B–D) Projections of confocal z-stack images of 54 hpf hearts expressing the flow-responsive marker Tg(TP1:VenusPEST)s940 in heat-shocked wild-type (WT) (B), heat-shock- (hs) induced krit1 overexpression (C), and hs-induced ccm2 overexpression (D). (E) Different ratios of corrected total tissue fluorescence (CTTF) of atrial versus ventricular (+atrioventricular canal region (AVC), arrowhead) expression of the flow-responsive marker Tg(TP1:VenusPEST)s940 between 54 hpf WT and krit1-overexpressing hearts (n = 37) and WT and ccm2-overexpressing hearts (n = 39). krit1- or ccm2-overexpression results in more equal chamber expression of flow-responsive marker Tg(TP1:VenusPEST)s940 expression (depicted is a WT heart corresponding to the krit1-overexpression experiment). (F) Fold change of relative fluorescence (CTTF) in the AVC of Tg(TP1:VenusPEST)s940 in krit1- and ccm2- overexpressing hearts versus the corresponding controls. Scale bars are 50 µm. Mean values ± SEM are shown. Unpaired t-test was used to compare each condition with the WT (*p<0.05, **p<0.01, ***p<0.001).