
|
Fig. 4
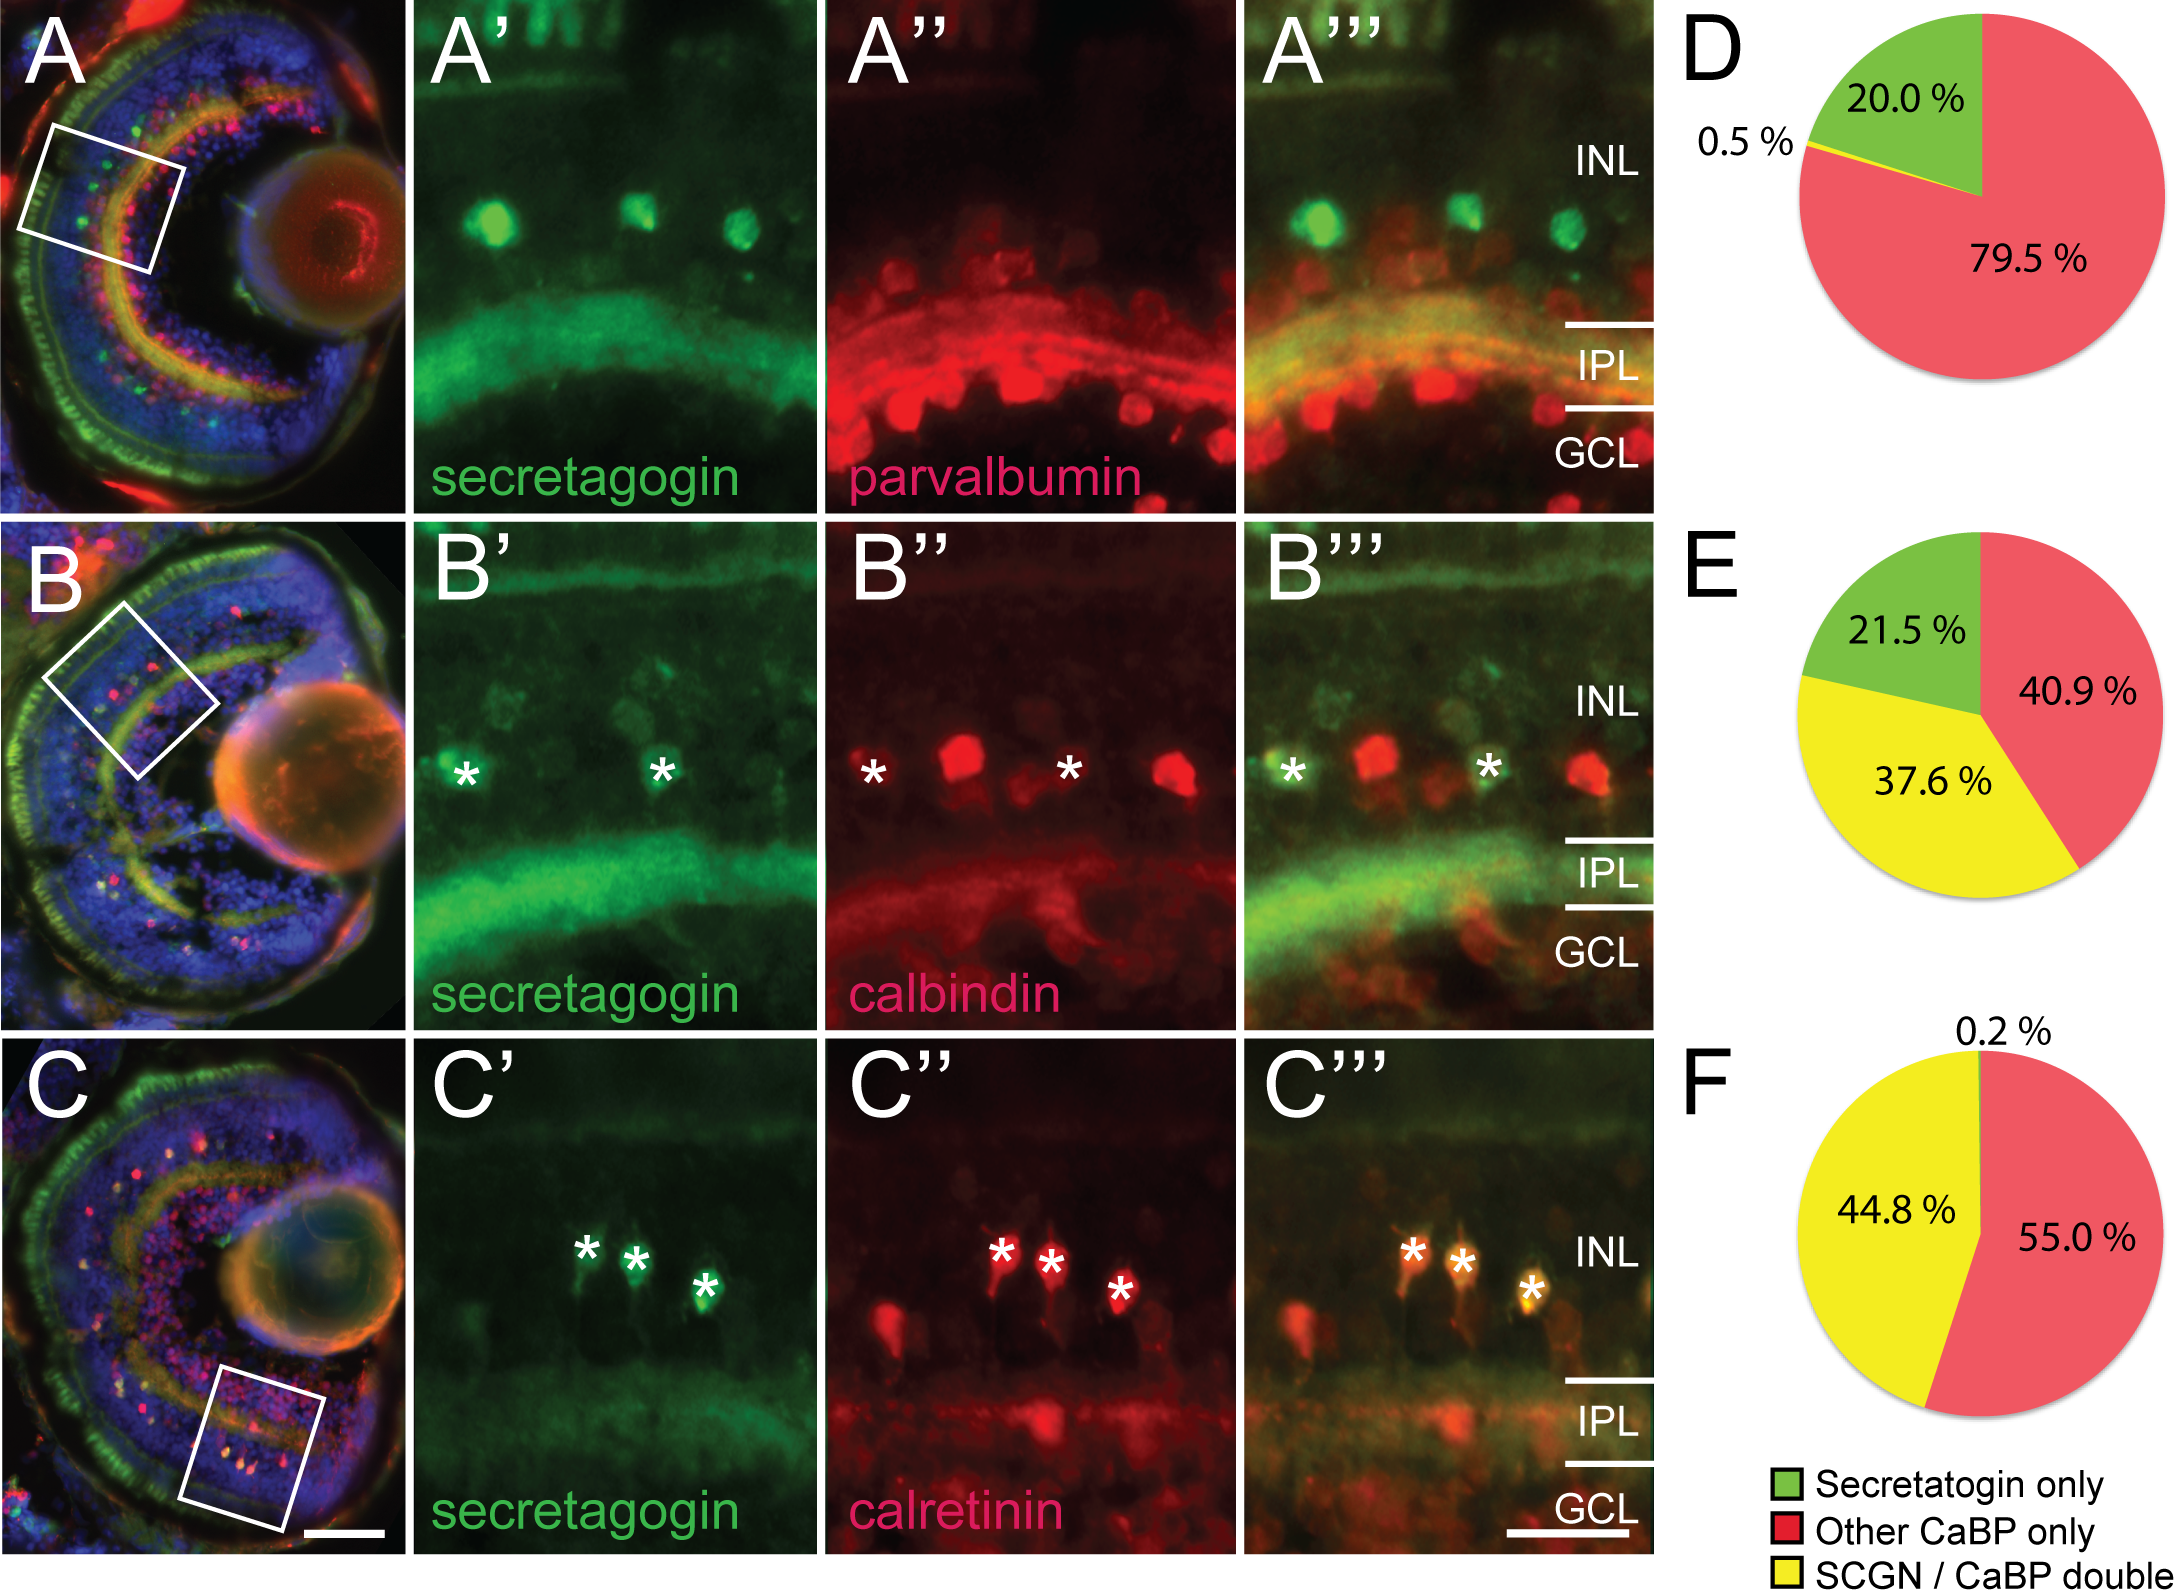
Comparative expression of secretagogin and other calcium binding proteins within the zebrafish retina.
(A–C) Micrographs showing cross-sections through zebrafish retina at 5 days postfertilization. Higher magnification of boxed regions in each row show secretagogin expression in green and other calcium binding protein expression in red: Parvalbumin (PV–A), Calbindin (CB–B), Calretinin (CR–C). (D–F) Pie charts show quantification of singe and double labeling (asterisks). Secretagogin labeled cells are mutually exclusive from parvalbumin (D) expressing cells, but overlap partially with calbindin (E) and represent a subpopulation of calretinin (F) expressing cells. Scale bar (C) for A–C is 50 μm, scale bar (C''') for A'–C''' is 20 μm.