
|
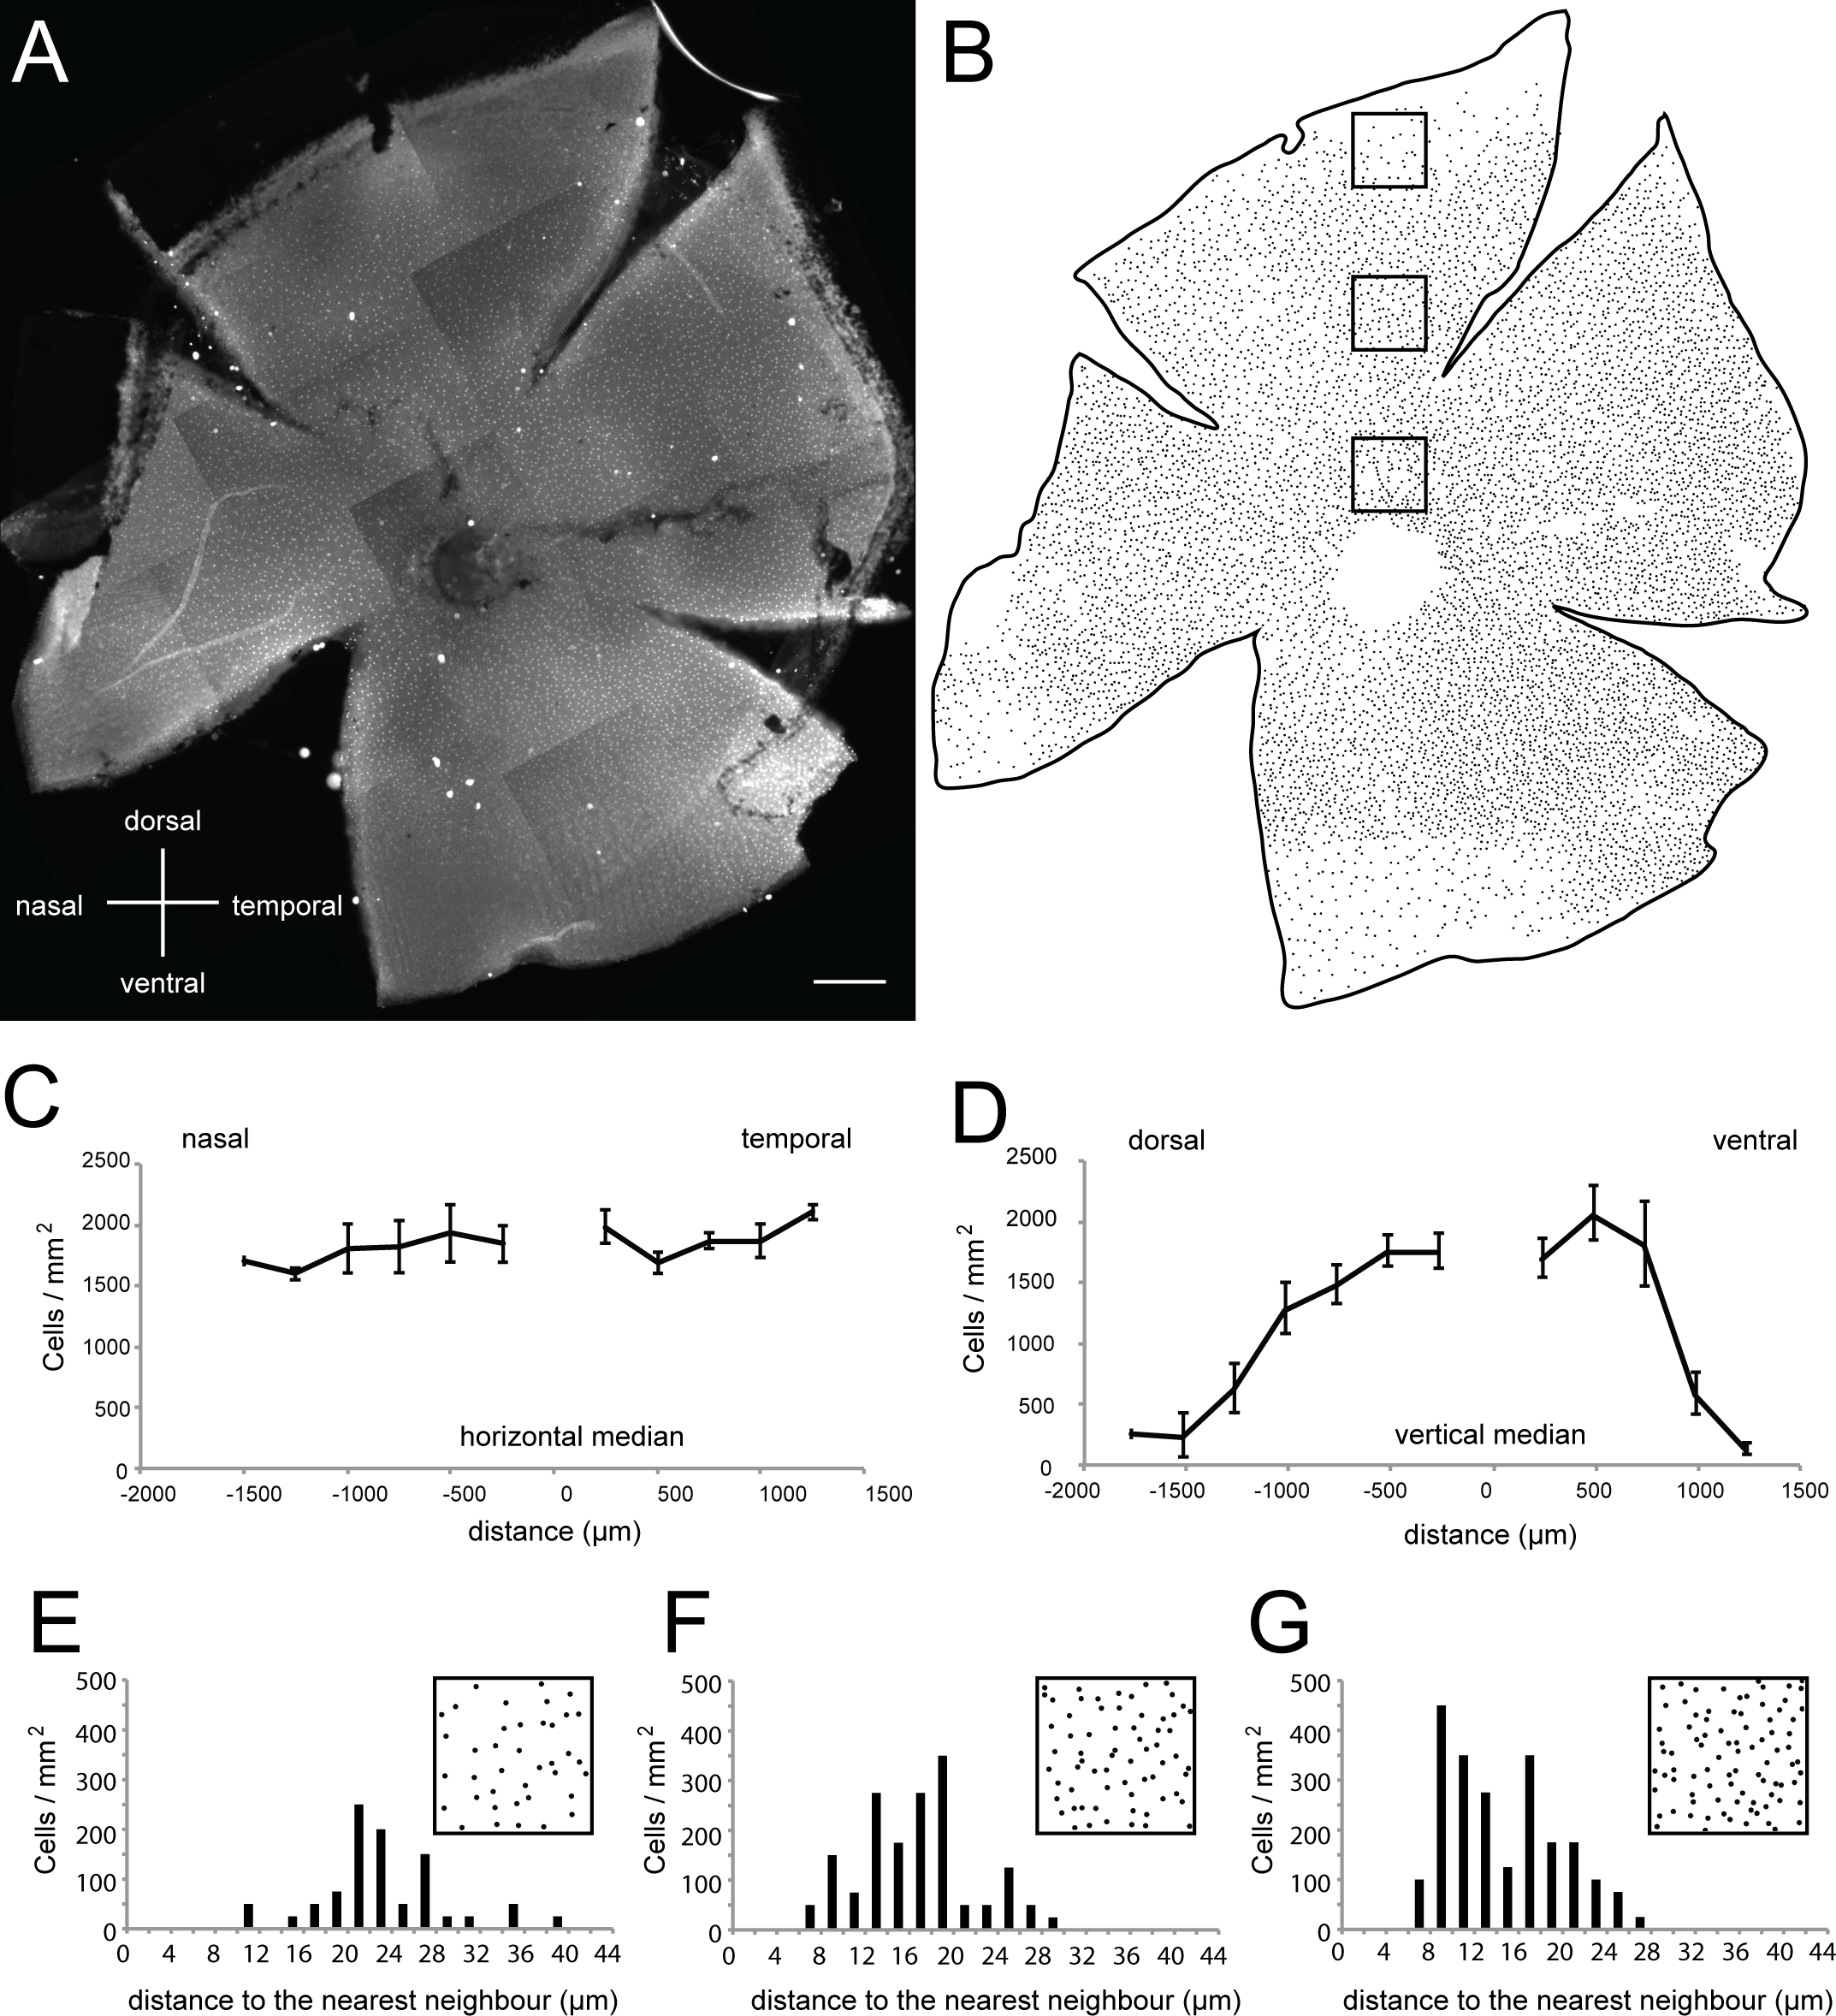
Fig. 3
Secretagogin positive cells from a regular mosaic with highest density along the horizontal midline.
(A, B) Micrograph collage and schematic showing secretagogin immunostaining in the inner nuclear layer of a flat mounted whole adult zebrafish retina. (C, D) Density of secretagogin labeled cells across the nasal-temporal (F) or dorsal-ventral (G) axes indicate high even density along the horizontal meridian, with the density along the dorsal-ventral axis peaking in central retina and decreasing towards the periphery (n = 20–21 ROIs for each of n = 3 adult eyes). Density was counted in ROIs (200 μm x 200 μm) every 250 μm until the edge of the retina. (E–G) Individual examples showing nearest neighbor analysis of region of interest (200 μm x 200 μm) indicated by boxed regions in B. Secretagogin labeled cells at any eccentricity are distributed regularly. ROIs were located at 250 μm, 750 μm and 1250 μm distance from the optic nerve center. Scale bar (A) is 200 μm.