
|
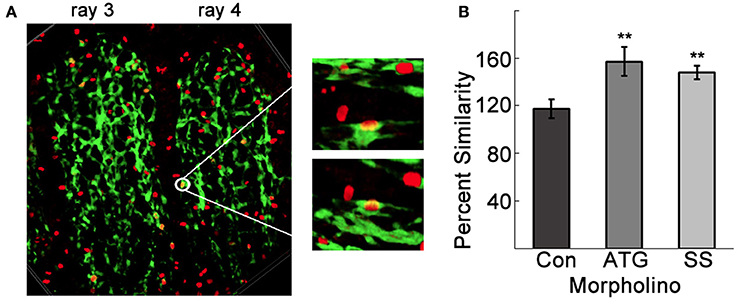
Fig. 5
Tmem184a knockdown results in increased endothelial cell proliferation. (A) Example confocal image projecting the third and fourth 4 dpa fin rays. The white circle highlights a point where fluorescence from GFP (green, ECs) H3P (red, Cy3 secondary antibody) overlap and look yellow. Zooming in on this point and rotating in a few different directions confirms nuclear H3P in an EC. (B) Quantitation of H3P/Fli1 ECs in the third and fourth fin rays of 4 dpa standard control, ATG, and SS MO-injected fins compared to third and fourth fin rays of the uninjected side. Graphs are shown as mean percent similarity ± S.E.M. **p < 0.01 compared to control. Data are representative of more than three independent experiments with at least four fish per experimental group.