
|
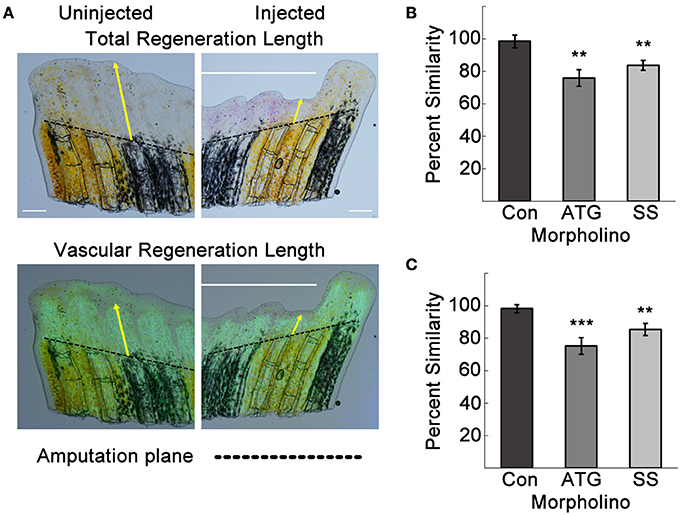
Fig. 4
Tmem184a knockdown results in decreased total and vascular regeneration. Total and vascular regeneration of the third fin ray of the uninjected and injected sides of each fin were measured from the amputation plane (dotted line) to the tip of the fin and the tip of the regenerating vasculature. (A) Example brightfield image and superimposed vascular fluorescence image with yellow arrows pointing out total and vascular regeneration length measurements. (B) Quantitation of total regeneration length of the third fin ray of control, ATG, and SS MO-injected fins compared to the uninjected side. (C) Quantitation of vascular regeneration length as in (B). Graphs are shown as mean percent similarity ± S.E.M. **p < 0.01, ***p < 0.001 compared to control. Data are representative of more than three independent experiments with at least four fish per experimental group. Scale bars = 200 μm.