
|
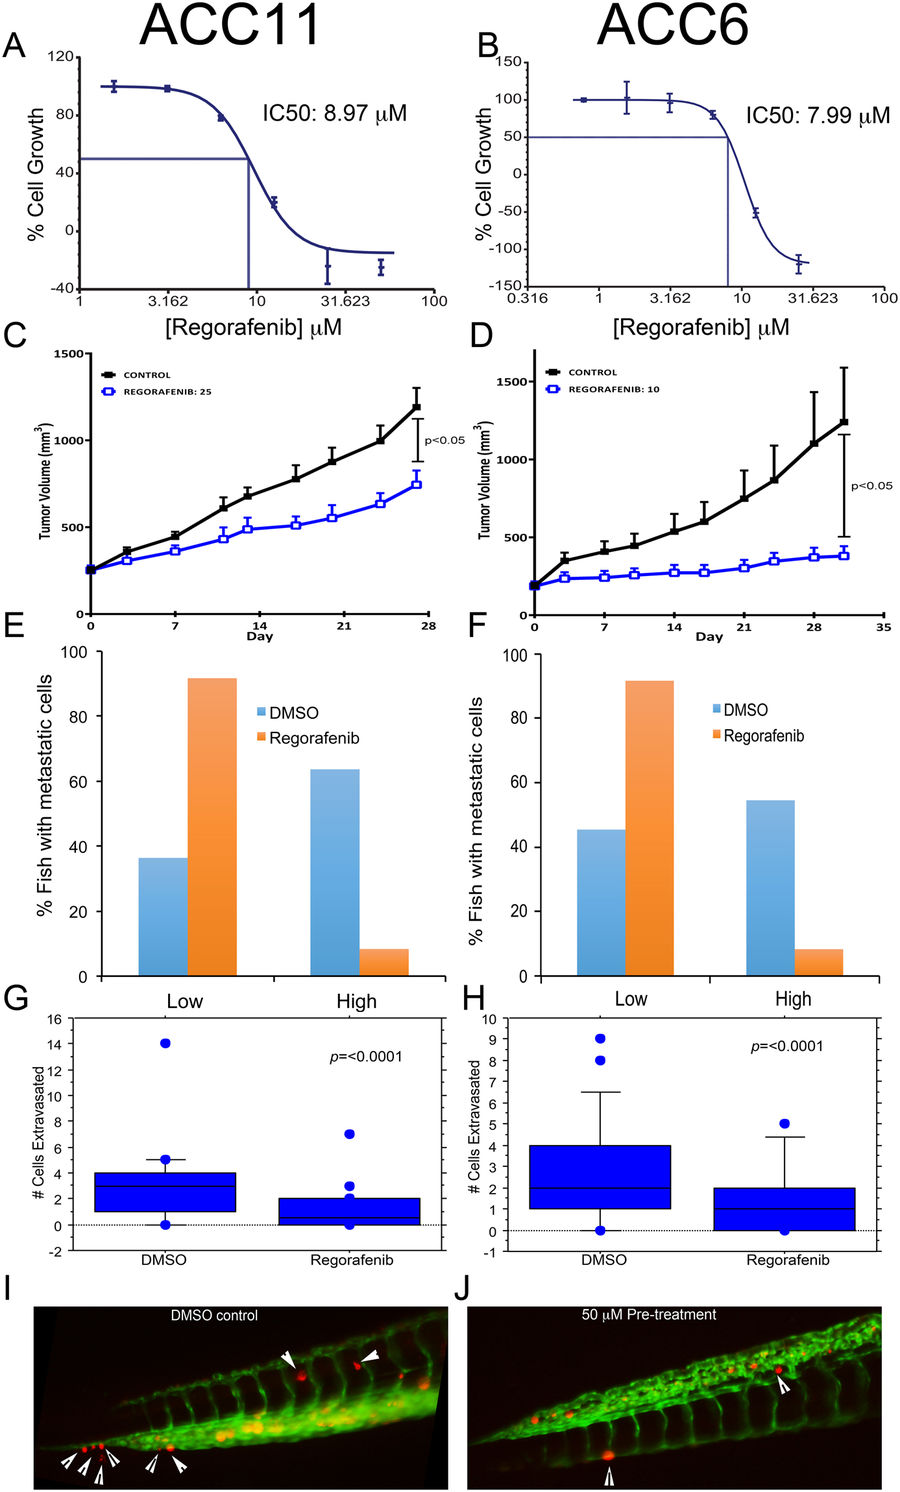
Fig. 7
ACC11 and ACC6 cells show similar drug sensitivity in cell-based and in zebrafish assays when compared to corresponding mouse xenograft drug sensitivity. A-B: Cell-based drug sensitivity assays for regorafenib for both ACC11 (A) and ACC6 (B) cells using Incucyte. (C,D) Regorafenib sensitivity of ACC11 (C) and ACC6 (D) in PDX model. E-F: Labeled ACC11 PDX tissue material (E) and ACC6 cells (F) were injected into the 2dpf zebrafish embryos and were arrayed in 96-well plate with continuous exposure to 0.3 μM of regorafenib or 1% DMSO (control group) in ZTM assay. Cells migrated to the tail after 5 days were scored in both groups. Fish with 0–3 cells were grouped as low and ≥ 4 cells migrated to the tail were grouped as high. Percentage fish with low and high metastatic cells for both treated and un-treated were plotted in excel. G-H: ACC11 cells (G) and ACC6 cells (H) were pre-treated with 50 μM regorafenib or 1% DMSO for 45 minutes prior to the injection into the yolk sinus in zebrafish extravasation assay. Fish were arrayed in 96-well plate and all were treated with 0.3 μM of regorafenib. Extravasation was scored in 24 hours for ACC11 (G) and 48 hours for ACC6 (H) cells. The results are plotted as box plots for each cell line. (I,J) Representative images for extravasated red labeled ACC11 cells in DMSO control group (I) and in 50 μM pre-treated group (J). White arrowhead points to the extravasated cells in the caudal region of the tail.