
|
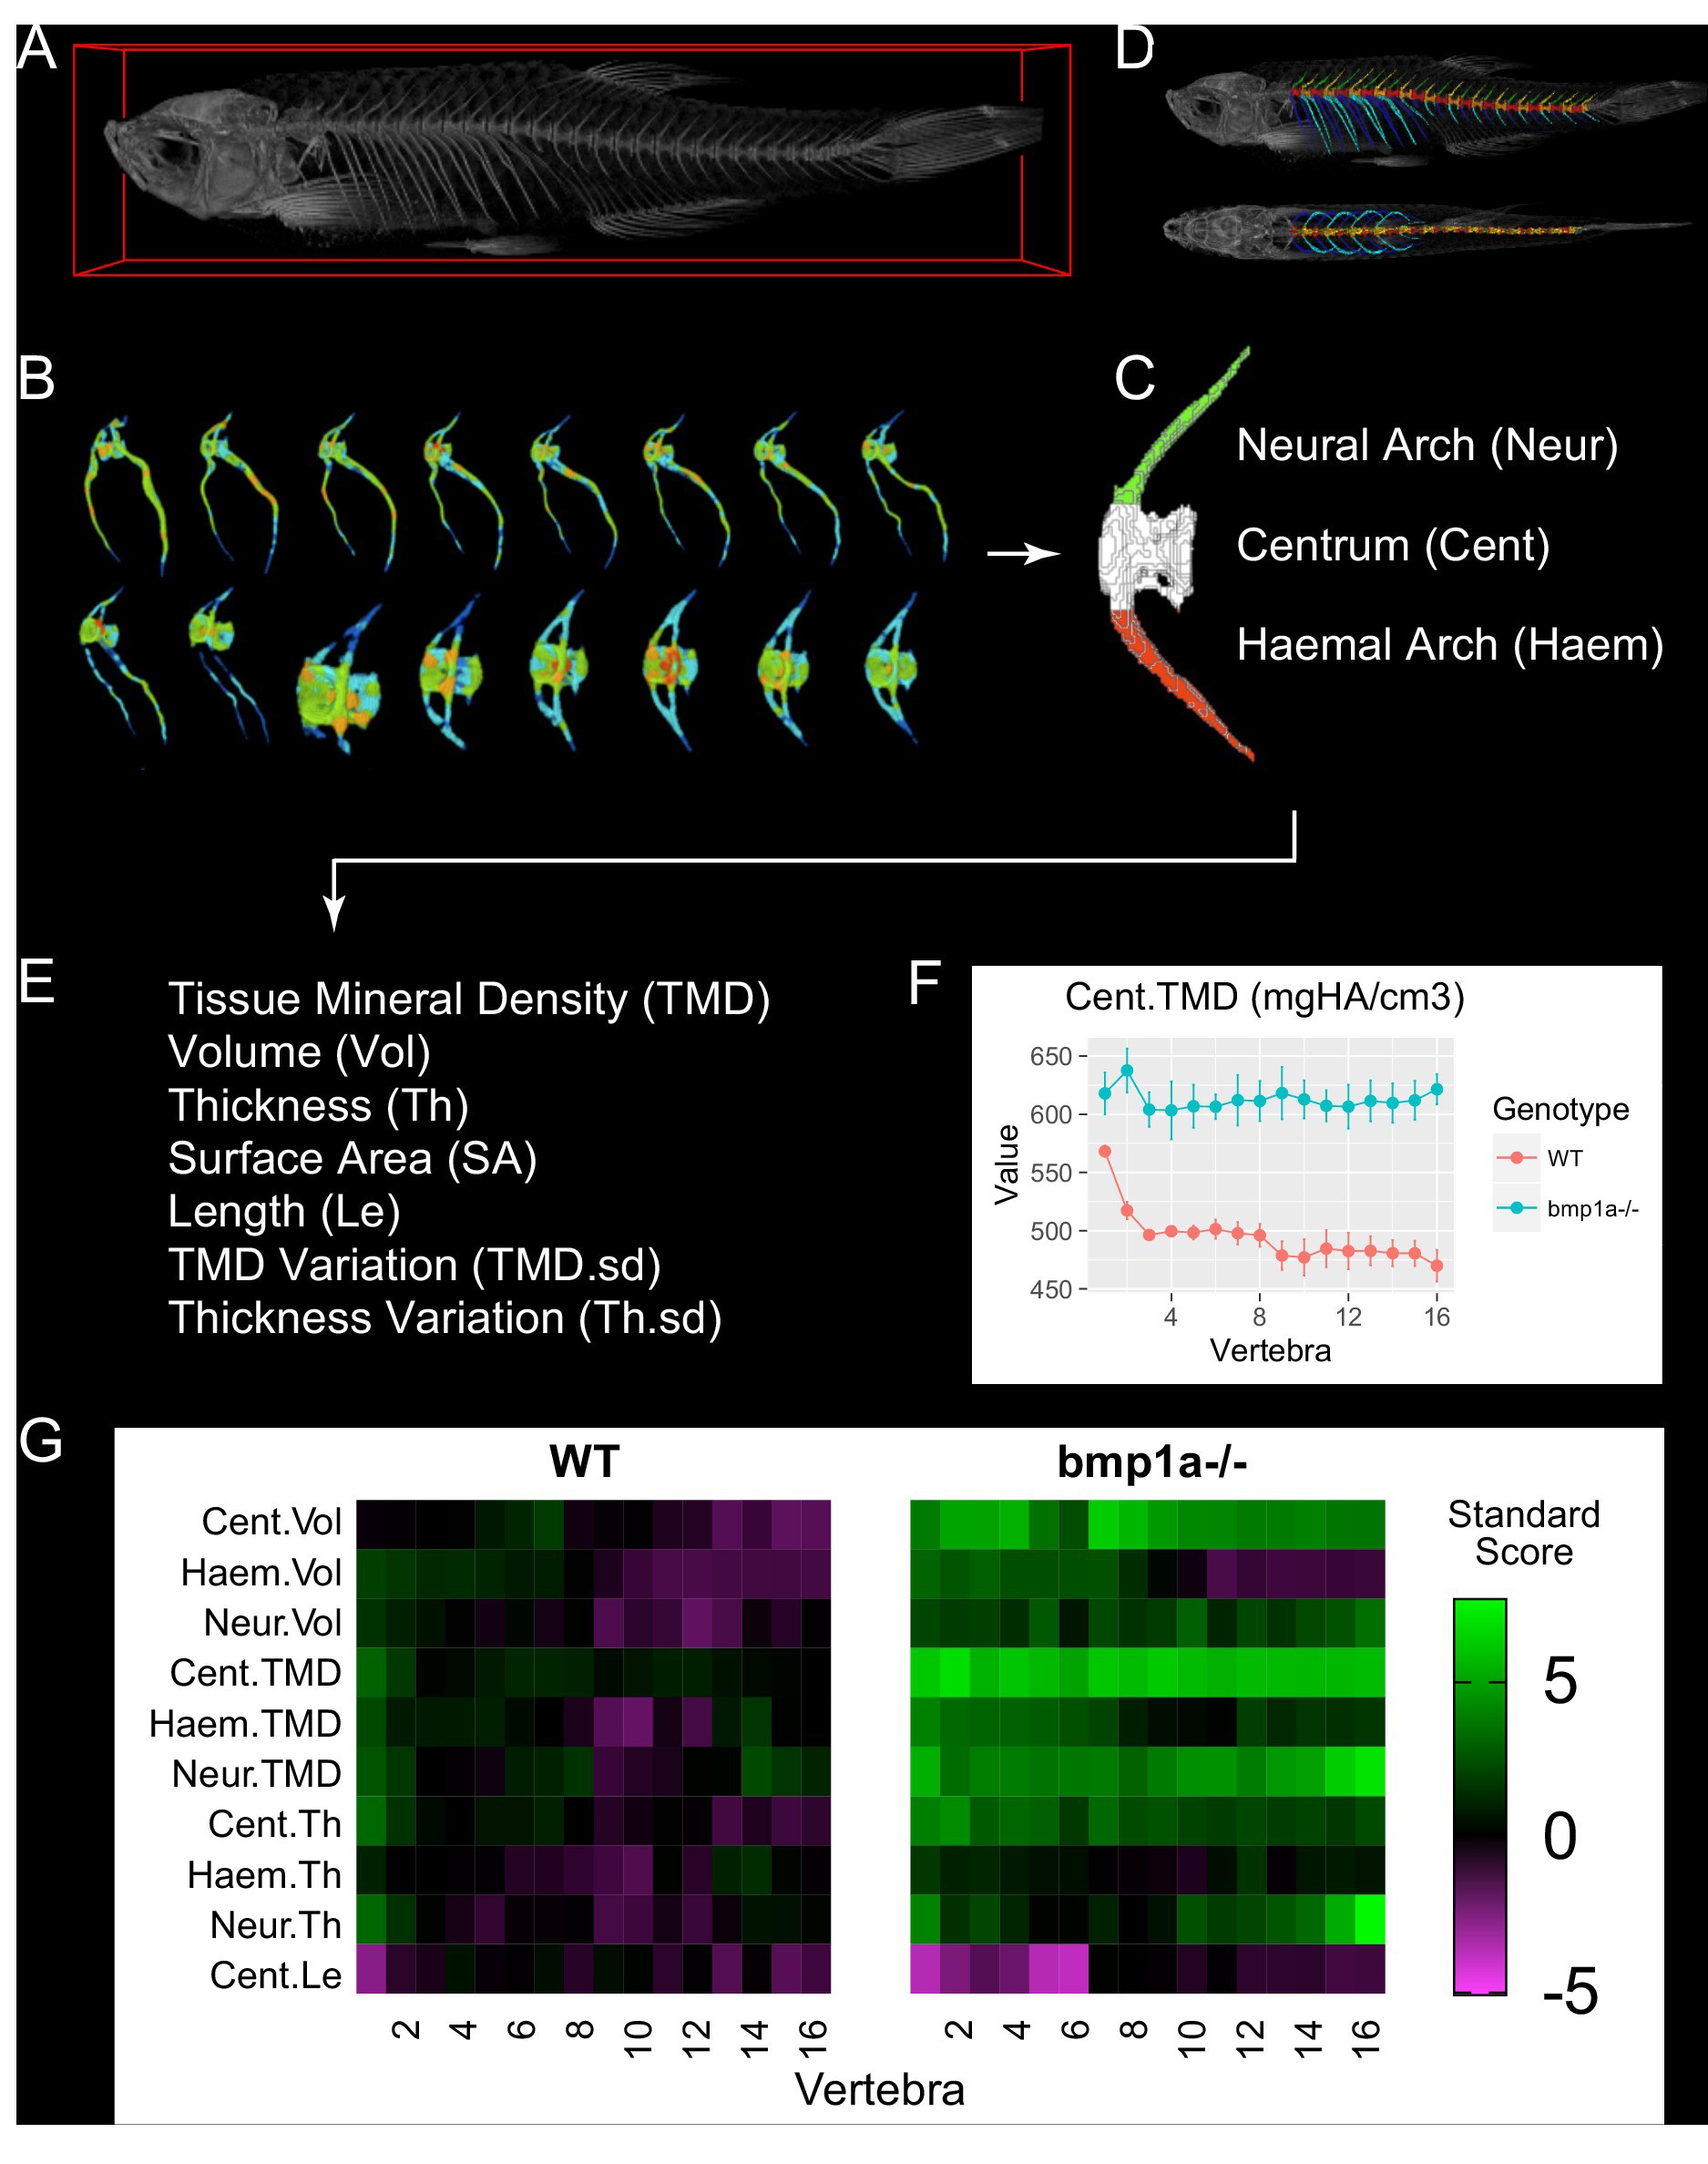
Fig. 1
MicroCT-based phenomics in the axial skeleton of adult zebrafish.
(A) MicroCT scans are acquired in adult fish (image shows 3D volume rendering). (B) For segmentation, individual vertebrae are isolated using FishCuT (image shows 16 vertebrae from the same fish, colors indicate local thickness), and (C) each vertebral body is segmented into three skeletal elements: the Neural Arch (green), Centrum (white), and Haemal Arch/Pleural Ribs (red). A representative segmentation can be seen in (D), which depicts the same fish in (A) with an alternating color scheme used to highlight individual skeletal elements segmented by FishCuT (top: lateral view; bottom: anteroposterior view). (E) For each skeletal element, FishCuT computes the following: Tissue Mineral Density, Volume, Thickness, Surface Area, Length (centrum only), Tissue Mineral Density Variation, and Thickness Variation. (F) For analysis, each combination of element/outcome is computed as a function of vertebra number, and subjected to the global test. Shown is a plot of one combination of element/outcomes, Cent.TMD, as a function of vertebra number in WT vs. bmp1a-/- fish. (G) Standard scores are computed and arranged into ‘skeletal barcodes’ that facilitate visualization of phenotypic trends both within individuals and across groups. Shown are the skeletal barcodes for a single WT (left) and bmp1a-/- fish (right).