
Image
|
Figure Caption
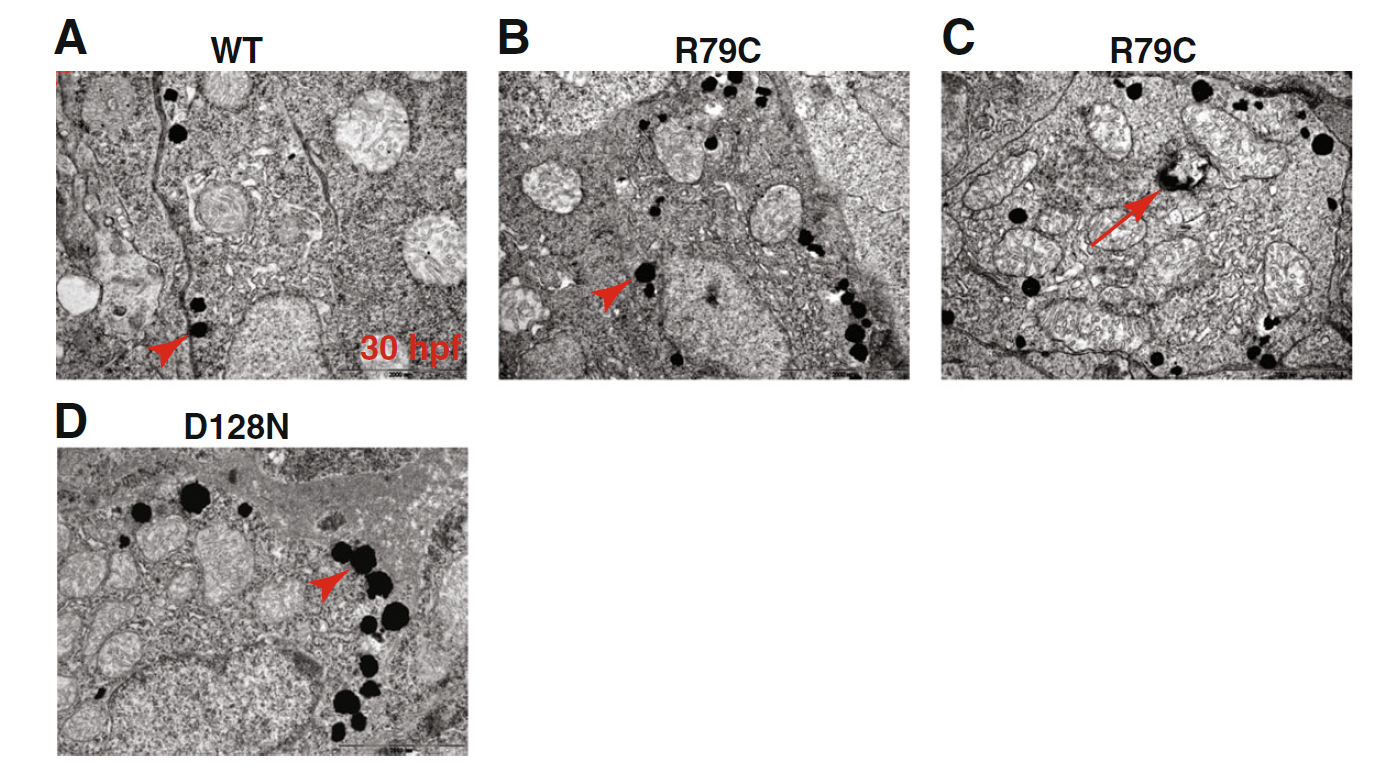
Fig. 4
Aggregation susceptibility of mutant GFAPs can be assessed using zebrafish. a-d Zebrafish embryos at one-cell stage were microinjected with expression plasmids encoding WT (a), p.Arg79Cys GFAP (b and c), or p.Asp128Asn (d), and imaged at 30 hpf with transmission electron microscopy. Arrows and arrowhead indicate electron dense inclusions and a spherical structure with double-layered membranes, respectively. Scale bar = 2 μm
Acknowledgments
This image is the copyrighted work of the attributed author or publisher, and
ZFIN has permission only to display this image to its users.
Additional permissions should be obtained from the applicable author or publisher of the image.
Full text @ BMC Neurol